CDPL Logo
Cinute Digital
Home
ServicesEventMentors
BlogContact

Data Science

  • Data Science - OverviewComprehensive Data Science and AI - Master ProgramMachine Learning and Data Science with PythonDeep Learning, NLP and Generative AIAdvanced Data Science & Machine Learning MasterclassMachine Learning Algorithms using python ProgrammingMachine Learning and Data Visualization using R ProgrammingPython Programming

Artificial Intelligence(AI)

  • Artificial Intelligence (AI) - OverviewPrompt Engineering with Gen AI

Software Testing Courses

  • Software Testing - OverviewManual Software TestingAPI Testing using POSTMAN and RestAPIsDatabase Management System using MySQLETL Testing CourseAdvanced Software TestingAdvanced Automation TestingAdvanced Manual and Automation TestingAdvanced Manual and Automation TestingJava Programming

Digital Marketing

  • Digital Marketing - OverviewDigital Marketing and Analytics - Master ProgramDigital Marketing and AI (For Business Owners)Digital Marketing With AI Bootcamp

Business Development(BI)

  • Business Intelligence (BI) - OverviewAdvanced Data Analytics - Hero ProgramAdvanced Data Analytics with Python LibrariesExcel for Data Analytics & VisualizationData Analytics & Visualization with TableauData Analytics & Visualization with Power BIData Analytics With BI And Big Data Engineering - Master Program

Blogs

  • BlogsSoftware TestingData ScienceWeb DevelopmentAI & Machine LearningDigital Marketing

Services

  • Campus to CorporateCustom TrainingExpert TalksFaculty DevelopmentGovt & Public Sector TrainingIndustrial VisitsInternship ProgramOn Job TrainingShort Term Training Program (STTP)Train the TrainerWorkshops

Certifications and Accreditation

  • AAA CertificationACTD CertificationValidate Your Certificate

Events

  • Business Analytics Course (Aldel Institute)MoU Signing (St. Francis)Job Fair (Nirmala Memorial)Industrial Visit (VIVA Institute)National Conference on AI (MKES)FDP on Power BI & Tableau (Bhavans College)Internship Program (DJ Sanghvi)TechoutsavIndustrial Visit (Thakur College)Placement Drive (Tech Mahindra)

Follow Us On

Follow Us On

Institute

  • HomeCMS LoginMock TestISTQB RegistrationServicesEventsMentorsPlacementsLive JobsJob OpeningsCareersAbout CDPLOur TeamReviewsAffiliate ProgramContact Us

Loading...

Loading...

All BlogsWeb DevelopmentData SciencePython ProgrammingArtificial Intelligence and Machine Learning (AI/ML)Digital MarketingBusiness Intelligence (BI)Software TestingArtificial IntelligenceAll Categories

Loading...

Ready for Career Guidance?

At CDPL Ed-tech Institute, we provide expert career advice and counselling in AI, ML, Software Testing, Software Development, and more. Apply this checklist to your content strategy and elevate your skills. For personalized guidance, book a session today.

City Wise

Software Testing City Wise

  • Software Testing Course in MumbaiSoftware Testing Course in DelhiSoftware Testing Course in AhmedabadSoftware Testing Course in ChennaiSoftware Testing Course in BengaluruSoftware Testing Course in PuneSoftware Testing Course in KolkataSoftware Testing Course in Hyderabad

Data Science City Wise

  • Data Science Course in MumbaiData Science Course in DelhiData Science Course in AhmedabadData Science Course in ChennaiData Science Course in BengaluruData Science Course in PuneData Science Course in KolkataData Science Course in Hyderabad

Business Intelligence City Wise

  • Business Intelligence Course in MumbaiBusiness Intelligence Course in delhiBusiness Intelligence Course in AhmedabadBusiness Intelligence Course in ChennaiBusiness Intelligence Course in BengaluruBusiness Intelligence Course in PuneBusiness Intelligence Course in KolkataBusiness Intelligence Course in Hyderabad

Artificial Intelligence City Wise

  • Artificial Intelligence Course in MumbaiArtificial Intelligence Course in delhiArtificial Intelligence Course in AhmedabadArtificial Intelligence Course in ChennaiArtificial Intelligence Course in BengaluruArtificial Intelligence Course in PuneArtificial Intelligence Course in KolkataArtificial Intelligence Course in Hyderabad

Digital Marketing City Wise

  • Digital Marketing Course in MumbaiDigital Marketing Course in delhiDigital Marketing Course in AhmedabadDigital Marketing Course in ChennaiDigital Marketing Course in BengaluruDigital Marketing Course in PuneDigital Marketing Course in KolkataDigital Marketing Course in Hyderabad
View All
Cinute Digital logo

Cinute Digital

Get In Touch

Head Office (CDPL)

Office #1, 2nd Floor, Ashley Tower, Kanakia Road, Vagad Nagar, Beverly Park, Mira Road, Mira Bhayandar, Mumbai, Maharashtra 401107

Study Center MeghMehul Classes (Vasai)

Shop No 7, Laxmi Palace, Opposite Vidhyavardhini Degree Engineering College, Gurunanak Nagar, Vasai West, Mumbai, Maharashtra - 401202
contact@cinutedigital.com
+91 78-883-837-88|+91 84-889-889-84
MSME
Skill India
Trustpilot
ISO 27001 Certified
ISO 9001 Certified
Privacy PolicyCookies PolicyTerms and ConditionsCancellation/Refund Policy

ISO 9001:2015 (QMS) 27001:2013 (ISMS) Certified Company.

© 2026 Cinute Digital Pvt. Ltd. — All Rights Reserved.

Powered By

Testriq_logo

Power Query Data Transformation: 5 Steps to Clean Data

Ashish Shetty
Ashish Shetty

Seasoned Business Intelligence and learning and development professional with over 11 years of experience empowering students and professionals to unlock career success through data-driven skills. Specializing in Power BI, Tableau, and Prompt Engineering, Ashish is known for delivering practical, high-impact workshops and training programs across academic and corporate sectors.

March 24, 2026•5 min read
Power Query Data Transformation: 5 Steps to Clean Data

Master data cleaning with our 5-step Power Query data transformation guide. Learn how to automate workflows and prepare your datasets for flawless analysis

In this comprehensive guide, we explore how Power Query revolutionizes the way businesses handle raw data. From connecting sources to leveraging Agentic AI concepts for autonomous data cleaning, learn the five essential steps to transform messy datasets into actionable insights.

Welcome to the ultimate guide on Power Query data transformation. If you spend hours every week manually formatting spreadsheets, deleting duplicate rows, and fixing broken text fields, you are wasting valuable time. In today’s fast-paced digital ecosystem, data is the lifeblood of decision-making. However, raw data is rarely ready for analysis; it is often messy, disorganized, and full of errors.

By mastering Power Query, you unlock the ability to turn chaotic datasets into clean, actionable intelligence. Think of it as your first step toward building autonomous workflows, where your data cleans itself upon arrival. Whether you are using Excel or Power BI, this comprehensive guide will walk you through the 5 steps to clean data efficiently. By the end of this article, you will understand how to build robust, automated pipelines that mimic the efficiency of modern Agentic AI giving you more time to focus on strategy rather than repetitive administrative tasks. Let's dive in!

Chapter 1: Why Power Query is Essential for Modern Business

Before we jump into the technical steps, we must understand the why. Businesses today gather data from dozens of sources: CRM systems, email marketing platforms, website analytics, and financial software. Merging these distinct sources manually is a nightmare.

Power Query acts as a powerful data connectivity and preparation technology. It enables business users to seamlessly access data stored in hundreds of sources and reshape it to fit their needs—all with an easy-to-use, highly visual, and code-free interface.

The Shift Toward Autonomous Workflows

We are entering an era dominated by Agentic AI & Autonomous Workflows. While full AI agents might manage complex, multi-step cognitive tasks, the foundation of any autonomous business system is clean data. If an AI or an automated marketing script feeds on bad data, it will produce bad results. Power Query allows you to set up rules known as "applied steps" that automatically execute every time you refresh your data. This is the bedrock of business automation.

For companies looking to scale, integrating these automated data processes with comprehensive Digital Marketing Services ensures that campaign dashboards and performance metrics are always accurate and up-to-date.

Chapter 2: The Core Principles of Data Transformation

Data transformation is the process of converting data from one format or structure into another. In the context of business intelligence, it means taking "raw" data and turning it into "refined" data.

There are three main pillars to this process:

  1. Extraction: Pulling data from its original source (like a CSV file, a SQL database, or a web page).
  2. Transformation: Cleaning, shaping, formatting, and merging the data.
  3. Loading: Pushing the refined data into a destination (like an Excel worksheet or a Power BI data model).

This process is commonly known as ETL (Extract, Transform, Load). Power Query excels at the "Transform" phase. What used to require complex SQL queries or hundreds of lines of VBA code can now be accomplished with a few clicks of a mouse.

Chapter 3: Power Query Data Transformation: 5 Steps to Clean Data

Here is the meat of our guide. Follow these five essential steps to master Power Query data transformation and say goodbye to manual data scrubbing forever.

Step 1: Connecting and Extracting Your Data

The first step in any data workflow is getting your data into the system. Power Query makes this incredibly simple.

  • Open Power Query: In Excel, go to the Data tab and click Get Data. In Power BI, click Get Data on the Home ribbon.
  • Choose Your Source: You can connect to an Excel workbook, a text/CSV file, a folder containing multiple files, a SQL Server database, or even a live web page.
  • Load to Power Query Editor: Once you select your source, do not click "Load." Instead, click Transform Data. This opens the Power Query Editor, your new command center for data cleaning.

Pro Tip: If you have monthly sales reports dumped into a specific folder, use the "From Folder" connector. Power Query will automatically append new files added to that folder in the future, creating a truly autonomous workflow.

Step 2: Profiling and Removing Unnecessary Clutter

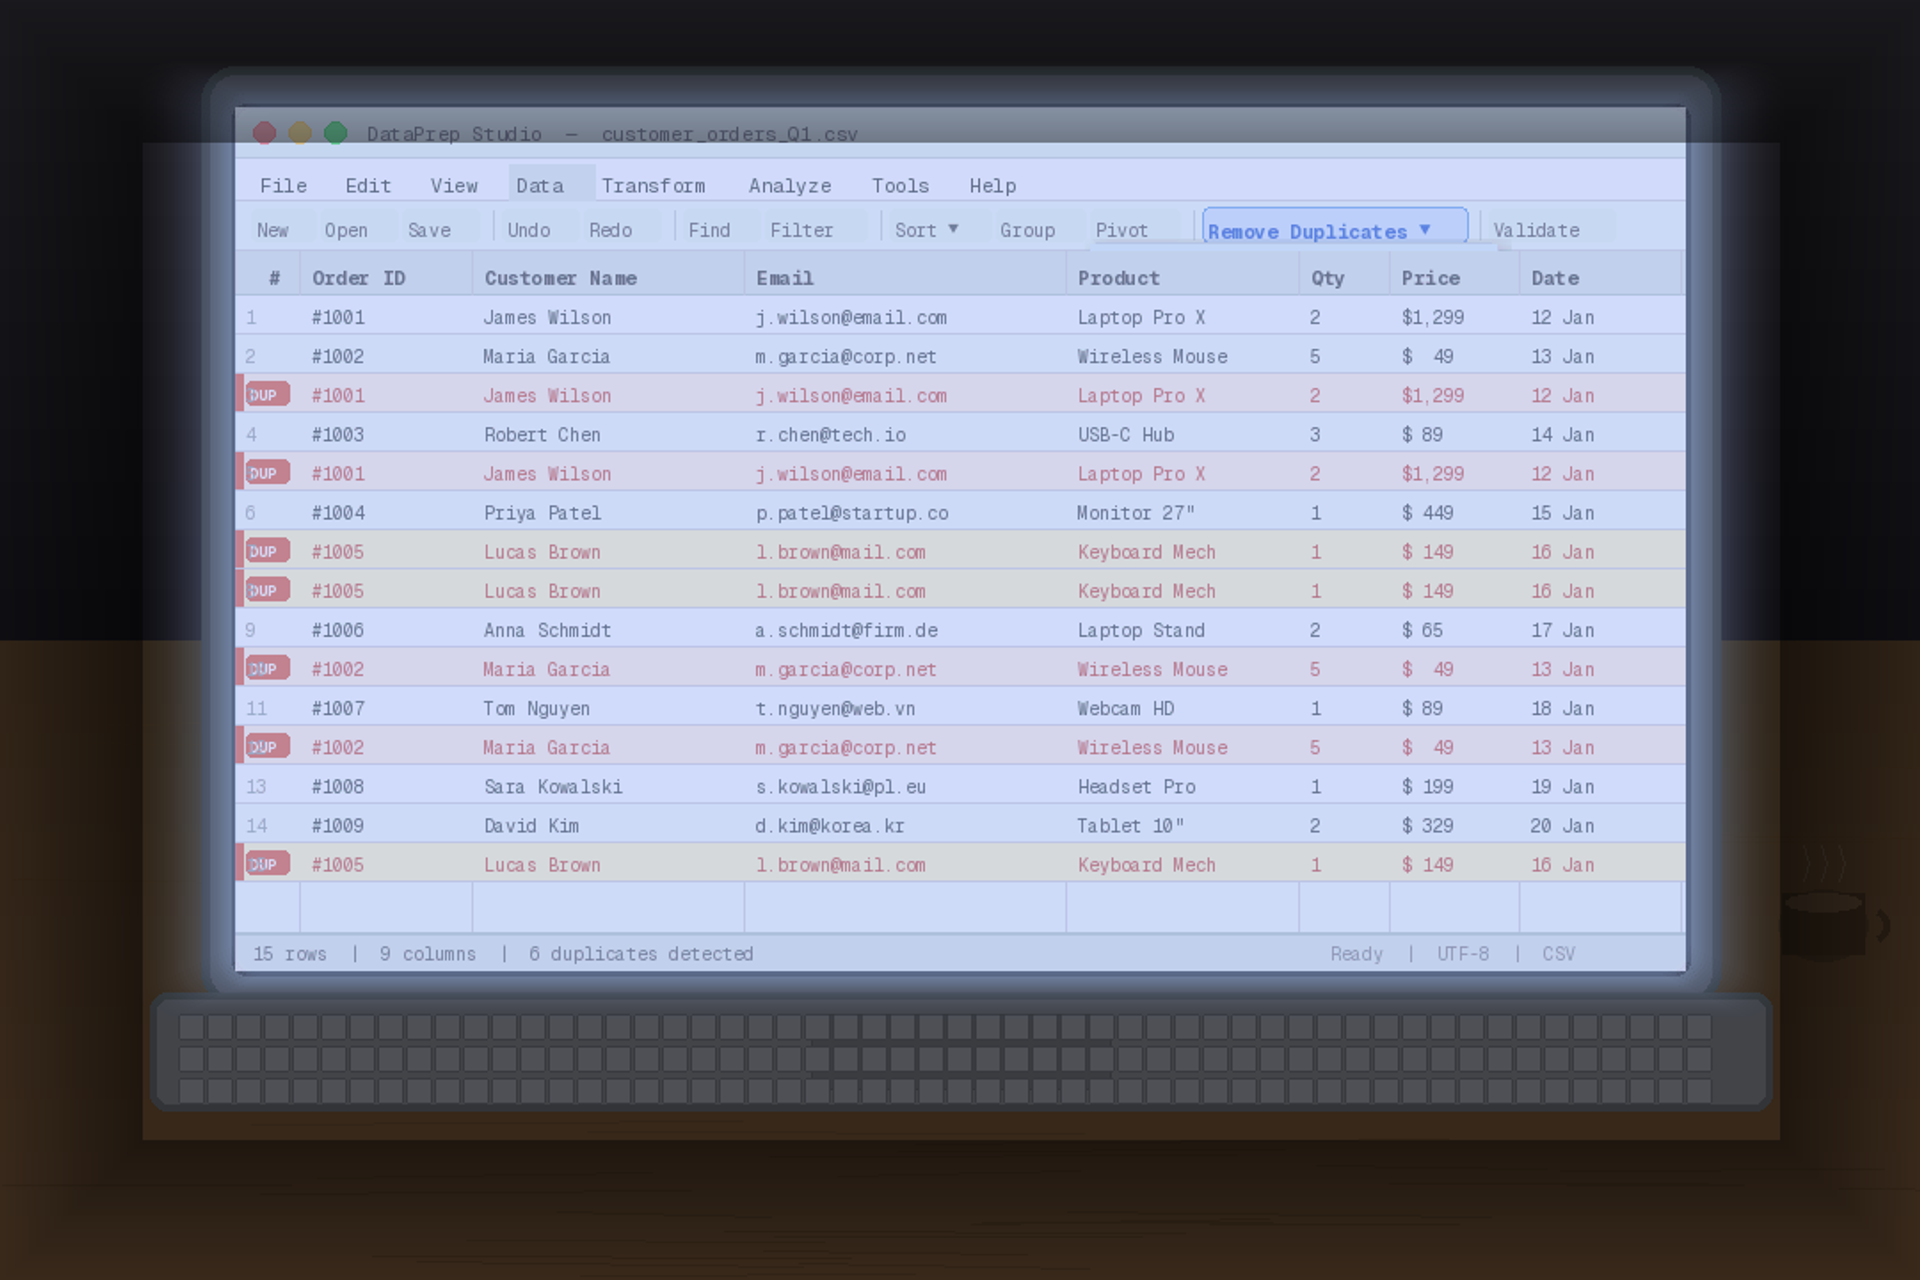
Raw data is often filled with things you don't need: blank rows, duplicate entries, and irrelevant columns. Sending this bloated data to your final model slows down performance.

Blog Image
  • Remove Top/Bottom Rows: Often, exported reports contain headers, titles, or footer totals that ruin data analysis. Use the Remove Rows button to strip away the top or bottom lines.
  • Remove Columns: Right-click the header of any column you don't need and select Remove. Even better, hold down the Ctrl key, select the columns you do want, right-click, and select Remove Other Columns. This ensures that if the source data adds unexpected columns later, they won't break your model.
  • Remove Duplicates: Select a column (or multiple columns) that should contain unique values, right-click, and choose Remove Duplicates.
  • Data Profiling: Go to the View tab and turn on Column Quality, Column Distribution, and Column Profile. This gives you an instant, visual read on how many errors or empty cells exist in your dataset.

Having clean, streamlined data is crucial for performance, much like how a well-optimized website structure is critical for SEO Search Engine Optimization.

Step 3: Standardizing Formats and Changing Data Types

Data types dictate how your software treats the information. If a date is formatted as "Text," you cannot filter it by month or year. If a currency is formatted as "Text," you cannot sum it up.

Blog Image
  • Change Data Types: Look at the small icon next to the column header name (e.g., ABC for text, 123 for whole numbers, a calendar icon for dates). Click this icon to change the data type to its proper format.
  • Trim and Clean: Sometimes, text data comes with invisible leading or trailing spaces (e.g., " Apple " instead of "Apple"). Select your text columns, go to the Transform tab, click Format, and choose Trim. You can also use Clean to remove non-printable characters.
  • Capitalization: In the same Format menu, you can standardize text to UPPERCASE, lowercase, or Capitalize Each Word. This ensures that "New York", "new York", and "NEW YORK" are all recognized as the exact same entity.
  • Replace Values: Similar to Excel's Find and Replace, you can right-click a column, select Replace Values, and swap out incorrect data (e.g., replacing "N/A" with "0" or "Null").

Step 4: Reshaping – Merging and Appending Queries

Rarely does all your necessary data live in one single table. You usually need to combine data from multiple places. Power Query offers two primary ways to do this: Merging and Appending.

Blog Image

Appending Queries (Stacking Data) If you have a table of January sales and a table of February sales, and you want to stack them on top of each other to create one master list, you use the Append Queries function.

  • Click Append Queries as New.
  • Select your two (or more) tables.
  • Power Query will match the column headers and stack the rows seamlessly.

Merging Queries (Joining Data) If you have a "Sales" table that only shows a "Customer ID," and a separate "Customer Directory" table that matches that ID to a "Customer Name," you need to merge them. This is the Power Query equivalent of a VLOOKUP or XLOOKUP, but vastly more powerful and less prone to crashing your computer.

  • Click Merge Queries.
  • Select your primary table and your secondary table.
  • Click the columns that share the common identifier (e.g., Customer ID).
  • Choose your Join Kind (usually Left Outer).
  • Expand the new column to reveal the "Customer Name" in your main sales table.

Combining complex datasets seamlessly requires high-level logic, much like how backend Web Development Services integrate various databases and APIs to make a website function smoothly.

Step 5: Automating the Refresh (The Magic Step)

Here is where the magic of Agentic AI & Autonomous Workflows begins to shine through your data processes. Everything you have done in Steps 1 through 4 has been recorded by Power Query in the "Applied Steps" pane on the right side of the screen.

Power Query did not change your original source data; it simply wrote a script of instructions (using a language called "M") to clean the data.

  • Close & Load: Once your data looks perfect, click Close & Load on the Home tab. The clean data will populate in your Excel sheet or Power BI model.
  • The Autonomous Refresh: Next week, when you get new raw data, you do not have to repeat Steps 1 through 4. Simply update your source file, go to your clean table in Excel, right-click, and hit Refresh.

Power Query will automatically reach out to the source, apply every single trimming, formatting, and merging rule instantly, and spit out the newly cleaned data in seconds. This saves hundreds of hours over a year and eliminates human error entirely.

Chapter 4: Advanced Tips for Data Analysts

Once you have mastered the basic 5 steps of Power Query data transformation, you can start exploring advanced techniques to further elevate your business intelligence.

1. Unpivoting Data

Often, financial data is provided in a "pivoted" format (e.g., Months acting as column headers across the top). This is great for human reading but terrible for database analysis. By selecting your identifier columns, right-clicking, and choosing Unpivot Other Columns, Power Query instantly transforms wide, messy spreadsheets into tall, machine-readable datasets.

2. Custom Columns with "M" Code

While the graphical interface handles 95% of tasks, Power Query is built on a coding language called M. You can write custom formulas to extract specific text, calculate date differences, or build conditional logic (If/Then statements) directly within the query editor.

3. Error Handling

When building automated workflows, you must plan for bad data. Use the Keep Errors or Remove Errors functions carefully. You can even set up conditional columns to flag data that doesn't meet specific criteria, ensuring your management team only sees verified metrics. Creating clean, error-free data reports is vital when analysing the success of your Content Strategy and Marketing, ensuring you know exactly which blogs and pages are driving traffic.

Chapter 5: The Impact of Clean Data on Business Growth

You might be wondering, "Is spending time learning Power Query really worth it?" The answer is a resounding yes.

When your data is clean, accurate, and automatically updated, the benefits cascade through your entire organization:

  • Faster Decision Making: Executives no longer have to wait days for end-of-month reporting. Dashboards can be updated daily or even hourly.
  • Cost Reduction: By eliminating manual data entry and cleaning, you free up your workforce to focus on high-value tasks, effectively reducing operational costs.
  • Improved Accuracy: Humans make typos. We accidentally delete rows. We mess up VLOOKUP formulas. Automated Power Query scripts do exactly what they are told, every single time.
  • Scalability: As your business grows and data volume increases, manual processes will break. Power Query handles millions of rows effortlessly.
Blog Image

To truly scale a business in 2026, combining automated data analytics with robust Data and Analytics Solutions allows companies to stay ahead of market trends, predict consumer behaviour, and outmanoeuvre the competition.

Frequently Asked Questions (FAQ)

Q1: Is Power Query only available in Microsoft Excel?

No, Power Query is the underlying data preparation engine for several Microsoft products, most notably Excel and Power BI. Learning it in one platform means you instantly know how to use it in the other.

Q2: Do I need to know how to code to use Power Query?

Not at all. The user interface is designed to be highly intuitive, allowing you to perform complex data transformations using a ribbon and right-click menus. However, advanced users can learn the "M" formula language to write custom code.

Q3: Will Power Query alter my original source data?

No. Power Query only creates a connection to your source data. All the steps you apply to clean and transform the data happen in the query editor and are outputted to a new destination. Your original files remain completely untouched and safe.

Q4: Can Power Query handle large datasets better than standard Excel? Absolutely. Standard Excel often crashes or slows down significantly when dealing with hundreds of thousands of rows. Power Query is highly optimized and can process millions of rows of data efficiently without lagging your workbook.

Q5: How does Power Query relate to Agentic AI?

Agentic AI relies on autonomous agents to execute complex tasks. For an AI to analyse business trends or make automated decisions, it requires flawlessly clean data. Power Query automates the data extraction and cleaning pipeline, serving as the foundational layer that feeds high-quality data into advanced AI models.

Conclusion

Mastering Power Query data transformation is no longer just a neat trick for data nerds; it is a mandatory skill for modern professionals. By following these 5 steps to clean data connecting, profiling, standardizing, reshaping, and automating you transition from a manual data laborer to a strategic data architect.

You are laying the groundwork for true autonomous workflows. As technology continues to evolve toward Agentic AI, those who understand how to structure and clean their data will be the ones leading the charge. Stop fighting with messy spreadsheets today, open up Power Query, and let the software do the heavy lifting for you!

Ready to elevate your analytics skills even further? Dive deeper into advanced data modelling, machine learning, and predictive analytics by exploring our comprehensive Data Science Course today

Tags

#Power Query#Data Transformation#Excel#Data Cleaning#Automation
Ashish Shetty
Ashish Shetty

Seasoned Business Intelligence and learning and development professional with over 11 years of experience empowering students and professionals to unlock career success through data-driven skills. Specializing in Power BI, Tableau, and Prompt Engineering, Ashish is known for delivering practical, high-impact workshops and training programs across academic and corporate sectors.

March 24, 2026•5 min read

Share this article

TwitterLinkedInFacebook

Related Posts

1

Is Big Data Spark the Best IT Skill for Freshers ?

Data Science
2

Model Deployment with Flask: Land an ₹8 LPA ML Job

Data Science
3

Master Excel Analytics: Beginner Tips That Pay in 2026

Data Science
4

Ultimate Guide: How to Clean Data and Get Hired Fast

Data Science
5

Simple Machine Learning Algorithms to Kickstart Your Career

Data Science

Categories

Web Development7Data Science16Python Programming2Artificial Intelligence and Machine Learning (AI/ML)2Digital Marketing7Business Intelligence (BI)8Software Testing13Artificial Intelligence5
View All Categories

Newsletter

Get the latest articles and insights delivered directly to your inbox.

No spam. Unsubscribe anytime.

Popular Tags

#Python#Backend Development#Web Development#Django#Flask#Data Engineering#Apache Spark#IT Careers India#Fresher Jobs#PySpark