The Most Important Statistics Concepts for Data Science


Master the mathematical backbone of AI and machine learning. From probability and descriptive stats to regression and Bayesian logic, discover the essential statistics concepts every data scientist needs to build reliable models, understand complex datasets, and power the next generation of autonomous workflows.
Stop guessing and start predicting. Explore the foundational math behind today's most powerful algorithms, from basic descriptive metrics to the advanced inferential statistics driving autonomous AI workflows
When diving into the world of artificial intelligence and machine learning, mastering the Important Statistics Concepts for Data Science is not just an option—it is a fundamental necessity. In 2026, as the industry shifts toward complex systems like Agentic AI and autonomous workflows, the mathematical foundations that govern data have never been more critical. Without a firm grasp of statistical theory, a data scientist is simply guessing. Statistics provides the framework to clean chaotic data, train predictive models, and validate results with absolute certainty. Whether you are building complex algorithms or developing custom software solutions, statistics acts as the bridge between raw data and actionable business intelligence. In this comprehensive guide, we will break down the essential statistical concepts—from probability to regression—in a way that is easy to understand, practical, and immediately applicable to your next data project.
Why Statistics is the Backbone of Data Science
To understand why statistics is so crucial, we must look at what data scientists actually do. Data science is the intersection of computer science, domain knowledge, and mathematics. While coding languages like Python and R are the tools used to build models, statistics is the underlying logic that makes those models intelligent.
Data is inherently messy. It contains outliers, missing values, and noise. Statistics provides the methodology to cut through this noise and find the signal. When an organization utilizes professional data analytics services, they aren't just looking for charts and graphs; they are looking for statistical confidence. They want to know that the trends they are seeing are real and not just a product of random chance.
Furthermore, the rise of Agentic AI—artificial intelligence that can autonomously make decisions and execute workflows—relies heavily on statistical probability. These autonomous agents use probabilistic models to evaluate their environments, weigh the likelihood of different outcomes, and choose the optimal path forward. Without a deep understanding of concepts like Bayes' Theorem and Markov Chains, building reliable autonomous systems is impossible.
Descriptive Statistics: Understanding Your Data
Before you can make predictions about the future, you must thoroughly understand the present. Descriptive statistics is the branch of statistics devoted to summarizing and organizing data so it can be easily understood. It does not try to make inferences beyond the data provided; it simply describes what is there.

Measures of Central Tendency
Central tendency refers to the "middle" or "typical" value of a dataset.
- Mean (Average): The sum of all values divided by the number of values. While highly useful, the mean is incredibly sensitive to outliers.
- Median: The middle value when the data is sorted. The median is robust against outliers, making it a critical metric when analyzing skewed data (like income or housing prices).
- Mode: The most frequently occurring value in the dataset. This is particularly useful for categorical data.
Measures of Dispersion (Spread)
Knowing the middle of your data isn't enough; you need to know how spread out the data points are.
- Variance: This measures how far each number in the set is from the mean, squared. A high variance indicates that the data points are very spread out from the mean.
- Standard Deviation: The square root of the variance. This is one of the most widely used metrics in data science because it is expressed in the same units as the original data, making it easy to interpret.
- Range: The difference between the highest and lowest values.
- Interquartile Range (IQR): The range of the middle 50% of the data. IQR is heavily used in boxplot visualizations to identify outliers during the data cleaning phase.
Skewness and Kurtosis
- Skewness measures the asymmetry of a distribution. If a dataset is "right-skewed," it has a long tail on the right side. Understanding skewness is vital because many machine learning models assume a normal (symmetrical) distribution.
- Kurtosis measures the "tailed ness" of the distribution. High kurtosis means the dataset has heavy tails (more outliers), which drastically affects risk assessment models.
If you are developing complex web platforms, understanding these metrics ensures that the user data you collect is accurately summarized before it is fed into your algorithms. Good web development combined with robust statistical tracking creates a seamless user experience.
Inferential Statistics: Making Predictions
While descriptive statistics summarize the data you have, inferential statistics allow you to make predictions or generalizations about a larger population based on a smaller sample. This is where the true power of data science lies.
Hypothesis Testing

Hypothesis testing is the core of scientific decision-making. It allows you to test an assumption regarding a population parameter.
- Null Hypothesis (H0): The default assumption that there is no relationship or no difference between groups.
- Alternative Hypothesis (H1): The assertion that there is a statistically significant relationship or difference.
For example, if you are running an A/B test for digital marketing strategies, your null hypothesis might be that "Changing the colour of the checkout button has no effect on conversion rates." Hypothesis testing mathematically determines if the data supports rejecting that null hypothesis.
P-Values and Statistical Significance
The p-value is perhaps the most misunderstood concept in data science. The p-value measures the probability of obtaining your observed results assuming that the null hypothesis is true.
- A low p-value (typically < 0.05) indicates strong evidence against the null hypothesis, so you reject the null hypothesis.
- A high p-value (> 0.05) indicates weak evidence against the null hypothesis, so you fail to reject it.
Important Note: A p-value does not tell you the probability that the alternative hypothesis is true. It simply measures how incompatible your data is with the null hypothesis.
Type I and Type II Errors
When making inferences, models will inevitably make mistakes.
- Type I Error (False Positive): Rejecting the null hypothesis when it is actually true. (e.g., Telling a healthy patient they have a disease).
- Type II Error (False Negative): Failing to reject the null hypothesis when it is false. (e.g., Telling a sick patient they are healthy).
Balancing these errors is a critical task for data scientists, especially in fields like medical diagnostics or fraud detection.
Probability Theory: The Language of Uncertainty
Data science is essentially the science of making decisions under uncertainty. Probability theory provides the mathematical language to quantify that uncertainty.
Core Probability Concepts
- Independent Events: The outcome of one event does not affect the outcome of another (e.g., flipping a coin twice).
- Dependent Events: The outcome of the first event affects the probability of the second (e.g., drawing cards from a deck without replacement).
- Mutually Exclusive Events: Events that cannot happen at the same time (e.g., turning left and turning right simultaneously).
Bayes' Theorem

Bayes' Theorem is arguably the most important probabilistic concept for advanced AI. It describes the probability of an event based on prior knowledge of conditions related to the event.
Formula: P(A|B) = [P(B|A) * P(A)] / P(B)
In plain English, Bayes' Theorem allows data scientists to update their predictions as new evidence becomes available. This is the foundational logic behind spam filters, medical testing, and Agentic AI workflows. When an autonomous agent encounters a new obstacle, it uses Bayesian logic to update its probability of success and adjust its route accordingly.
Probability Distributions
A probability distribution is a mathematical function that provides the probabilities of occurrence of different possible outcomes in an experiment.
- Normal Distribution (Gaussian): The famous "bell curve." It is symmetrical, and most of the observations cluster around the central peak. In a perfect normal distribution, the mean, median, and mode are all equal.
- Binomial Distribution: Used for discrete outcomes where there are only two possibilities (Success/Failure, Yes/No, Heads/Tails).
- Poisson Distribution: Measures the probability of a given number of events happening in a fixed interval of time or space (e.g., the number of emails received in an hour).
Understanding these distributions allows you to choose the correct machine learning algorithm for your specific dataset.
Regression Analysis: Modelling Relationships
If you want to forecast future trends or understand the relationship between variables, you must master regression analysis. This is the stepping stone from traditional statistics into supervised machine learning.
Simple Linear Regression
Simple linear regression models the relationship between two variables by fitting a linear equation to the observed data. One variable is considered to be an independent (explanatory) variable, and the other is a dependent (response) variable.
- Example: Predicting a person's weight (dependent) based solely on their height (independent).
The goal of linear regression is to find the "line of best fit" that minimizes the sum of squared residuals (the difference between the actual data points and the predicted line).
Multiple Linear Regression
In the real world, outcomes are rarely dictated by a single variable. Multiple linear regression allows you to model the relationship between one dependent variable and multiple independent variables.
- Example: Predicting a house's price based on square footage, number of bedrooms, age of the house, and proximity to schools.
Logistic Regression
Despite its name, logistic regression is used for classification, not traditional regression. It is used when the dependent variable is categorical (e.g., Yes/No, True/False, Spam/Not Spam). Instead of predicting a continuous value, logistic regression predicts the probability that an instance belongs to a given class, using a sigmoid function to map predictions between 0 and 1.
Dimensionality Reduction and Feature Selection
In the era of Big Data, data scientists are often handed datasets with thousands of variables (features). Feeding all of this data into a model causes a phenomenon known as the "Curse of Dimensionality." The model becomes too complex, trains slowly, and suffers from extreme overfitting.
Statistical techniques are required to reduce the number of variables while preserving the core patterns in the data.
Principal Component Analysis (PCA)
PCA is a statistical procedure that uses an orthogonal transformation to convert a set of observations of possibly correlated variables into a set of values of linearly uncorrelated variables called principal components. Simply put, PCA compresses your data. It finds the directions (components) that maximize the variance in the data and projects the data onto a smaller dimensional space.
Correlation Matrices
Before building a model, data scientists use a correlation matrix to find how strongly variables are related to one another. Variables that are highly correlated with the target variable are excellent predictors. However, if two independent variables are highly correlated with each other (multicollinearity), they provide redundant information and can distort the model.
Understanding how to mathematically select the right features is a skill that separates junior analysts from senior data scientists. When dealing with modern SEO optimization data, for instance, dimensionality reduction helps pinpoint the exact on-page factors driving traffic out of hundreds of potential ranking signals.
Evaluating Machine Learning Models
Building a model is only half the battle. You must mathematically prove that your model is accurate, reliable, and generalizes well to unseen data. Statistics provides the metrics for evaluation.
Evaluation Metrics for Regression
- Mean Absolute Error (MAE): The average of the absolute differences between predictions and actual values. It gives you an idea of how wrong your predictions are on average.
- Root Mean Squared Error (RMSE): Similar to MAE, but it squares the differences before averaging them. This heavily penalizes large errors, making it highly useful when large mistakes are particularly costly.
- R-Squared (Coefficient of Determination): A statistical measure that represents the proportion of the variance for a dependent variable that's explained by an independent variable. An R-squared of 100% means all movements of a dependent variable are completely explained by movements in the independent variables.
Evaluation Metrics for Classification
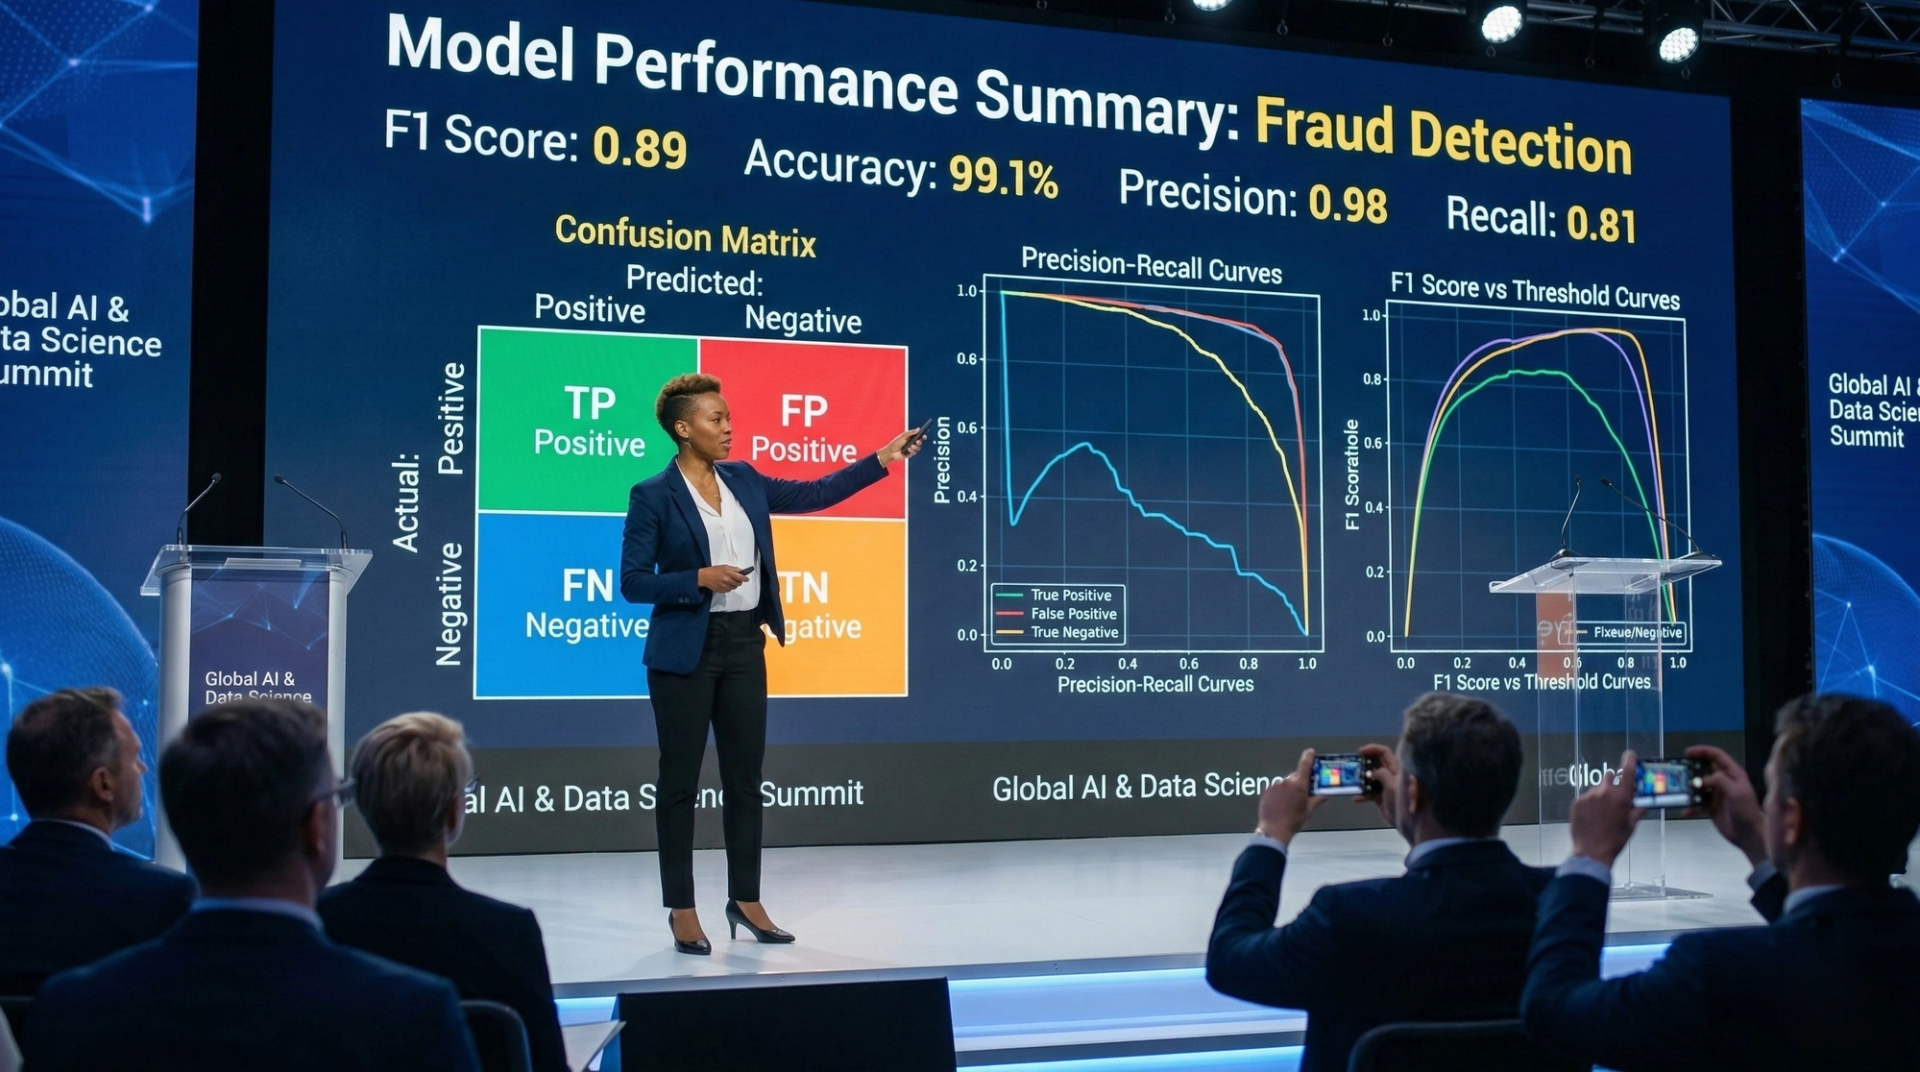
- Confusion Matrix: A table used to describe the performance of a classification model, breaking down True Positives, True Negatives, False Positives, and False Negatives.
- Precision: The ratio of correctly predicted positive observations to the total predicted positives. (Out of all the emails we flagged as spam, how many were actually spam?)
- Recall (Sensitivity): The ratio of correctly predicted positive observations to the all observations in actual class. (Out of all the actual spam emails, how many did we successfully flag?)
- F1 Score: The weighted average of Precision and Recall. It is significantly more useful than standard Accuracy when you have an uneven class distribution.
(Placeholder for Image 5: A beautifully designed, colorful Confusion Matrix chart explaining True Positives, False Positives, etc.)
Frequently Asked Questions (FAQ)
Q1: Do I need a math degree to learn statistics for data science?
No, you do not need a formal math degree. While a strong foundation in algebra and calculus helps, modern data science focuses heavily on applied statistics. Understanding the concepts, knowing when to use specific tests, and interpreting the results correctly is far more important than manually calculating complex formulas.
Q2: Which programming language is best for statistical analysis? Both Python and R are industry standards. R was built specifically for statisticians and has incredible libraries for data analysis right out of the box. Python is a more general-purpose language with powerful libraries like Pandas, NumPy, and SciPy, making it the preferred choice for machine learning and production deployment.
Q3: What is the difference between Bayesian and Frequentist statistics? Frequentist statistics interpret probability as the limit of the relative frequency of an event over time (e.g., flipping a coin infinitely). Bayesian statistics view probability as a measure of belief or certainty, which is updated as new evidence is introduced. Data science utilizes both, but Bayesian methods are particularly popular in AI and machine learning.
Q4: How often do data scientists use hypothesis testing in the real world? Constantly. Hypothesis testing is the backbone of A/B testing, which is used by product teams, digital marketers, and software developers to determine if a new feature, design, or algorithm actually improves user metrics.
Q5: What is statistical significance and why does it matter?
Statistical significance is a mathematical determination of whether a result from testing or experimenting is likely to be attributed to a specific cause, rather than random chance. It is crucial because making business decisions based on random noise can lead to massive financial losses.
Conclusion
The integration of advanced AI and Big Data has forever changed the technological landscape. However, beneath the flashy interfaces of Agentic AI and the complex architectures of neural networks lies the bedrock of traditional mathematics. Important Statistics Concepts for Data Science are not just theoretical academic exercises; they are practical tools used daily to solve real-world business problems.
By mastering descriptive statistics, you gain the ability to accurately view the world as it is. By mastering inferential statistics and probability, you gain the power to predict the future with calculated confidence. Whether you are optimizing a localized business campaign or architecting a global artificial intelligence network, these statistical foundations are the keys to long-term success. The data scientists who thrive in the coming decade will not just be the ones who write the cleanest code, but the ones who possess the deepest understanding of the statistical truths governing their data.
Tags

Cezzane Khan is a dedicated and innovative Data Science Trainer committed to empowering individuals and organizations.