Loading...
Loading...
Cinute Digital
Head Office (CDPL)
Study Center MeghMehul Classes (Vasai)


ISO 9001:2015 (QMS) 27001:2013 (ISMS) Certified Company.
© 2026 Cinute Digital Pvt. Ltd. — All Rights Reserved.

Still applying for jobs with just basic Excel skills? In 2026, employers want more and this guide shows you exactly how to upgrade your skills and stand out.
From pivot tables to advanced dashboards, this guide walks you through what Excel analytics actually means, why companies are paying premium salaries for it, and how you even as a complete beginner can start building this career skill today.
Picture this: You've just finished your degree. You send out 50 job applications. You list "Microsoft Excel" on your resume. And then… silence.
Here's the uncomfortable truth so does every other candidate.
In 2026, simply knowing how to type data into Excel cells is no longer a skill. It's just assumed. What employers are actively hunting for and struggling to find is someone who can turn raw data into decisions. Someone who knows Excel not just as a spreadsheet tool, but as an analytics engine.
The good news? Most students haven't figured this out yet. That gap is your opportunity.
This guide will show you exactly what Excel analytics means, which skills actually matter, and how to start learning in a way that puts real money in your hands whether you're a student in Mumbai, a fresher in Delhi, or a job seeker anywhere in the world.
The world is producing more data than ever before. Every business from a local grocery chain to a multinational bank is sitting on mountains of numbers they don't fully understand. That's where Excel analytics professionals come in.

Companies don't need someone to store data. They need someone who can read it, analyse it, and explain what it means in plain language. Excel, when used properly, is one of the most powerful tools to do exactly that.
According to recent job market data, roles requiring Excel analytics skills such as Data Analyst, MIS Executive, Business Analyst, and Operations Analyst have grown significantly across industries like banking, e-commerce, consulting, and healthcare. In India alone, entry-level Data Analyst roles now commonly offer salaries between ₹4–7 LPA, with experienced professionals earning ₹12–20 LPA and beyond.
The best part? You don't need a Computer Science degree. You need the right skills, and the right roadmap.
Ready to build this skill from scratch? Join our beginner-friendly Excel Analytics training and start your journey today.
Before we go further, let's clear up the confusion. "Excel analytics" doesn't mean just knowing SUM and AVERAGE. Here's a simple breakdown:
Basic Excel → You can enter data, do simple calculations, and format cells.
Intermediate Excel → You can use VLOOKUP, IF statements, basic charts, and filters.
Excel Analytics (Advanced) → You can build Pivot Tables, use Power Query, create dynamic dashboards, run statistical analysis, automate with macros, and tell a clear data story to decision-makers.
It's that third level that employers are paying for and it's closer to reach than most students think.
Here's a look at roles that directly benefit from Excel analytics skills in 2026:
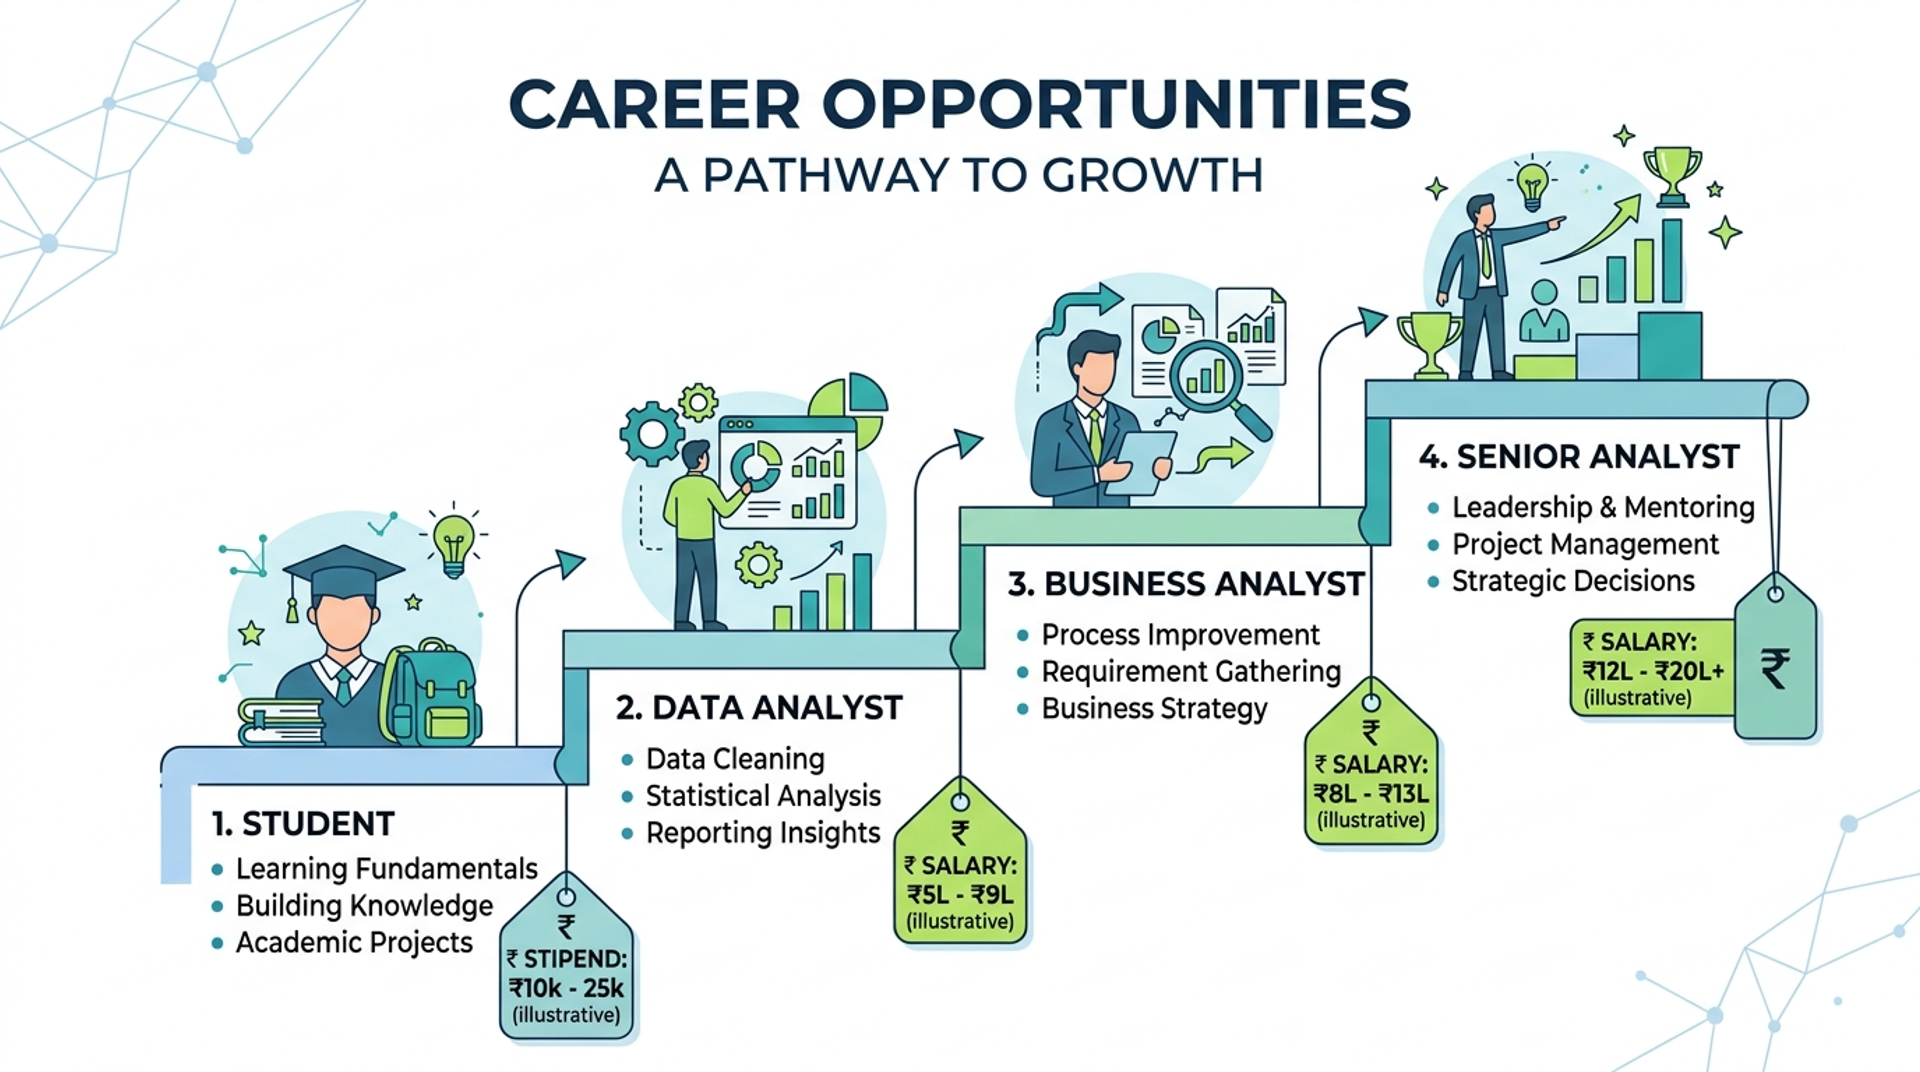
These are not niche roles they exist in every sector. And unlike coding-heavy roles, Excel analytics is something you can realistically learn within 60–90 days with consistent effort.
Want to see the fastest path to these roles? Explore our Data analytics course designed specifically for students and job seekers.
Learning from other people's mistakes is free. Here are the most common ones:
Mistake 1: Stopping at VLOOKUP Most students learn a handful of functions and assume they're "good at Excel." But recruiters test Pivot Tables, Power Query, and dashboards not just lookup formulas.
Mistake 2: Learning without context Watching random YouTube tutorials without a structured roadmap leads to scattered knowledge. You might know 30 functions but not know when to use which one in a real scenario.
Mistake 3: Not building projects Theory alone won't get you hired. Employers want to see a portfolio even one Excel dashboard you built yourself tells them more than a certificate.
Mistake 4: Underestimating speed Students often think this takes years. With the right structured training, core Excel analytics skills can be job-ready in 8–12 weeks.
Mistake 5: Using outdated resources Excel has evolved. Power Query, Power Pivot, and dynamic arrays are now core skills but many free tutorials still teach Excel as it existed 5 years ago.
Start here if you're a complete beginner.
This is where it gets powerful.

This is what separates you from 90% of other candidates.
Apply everything you've learned to build 2–3 portfolio projects:
These projects become your proof of skill in every interview.
Follow this exact roadmap inside our structured course. Start your career with our Excel Analytics training step by step, from beginner to job-ready.
To learn:
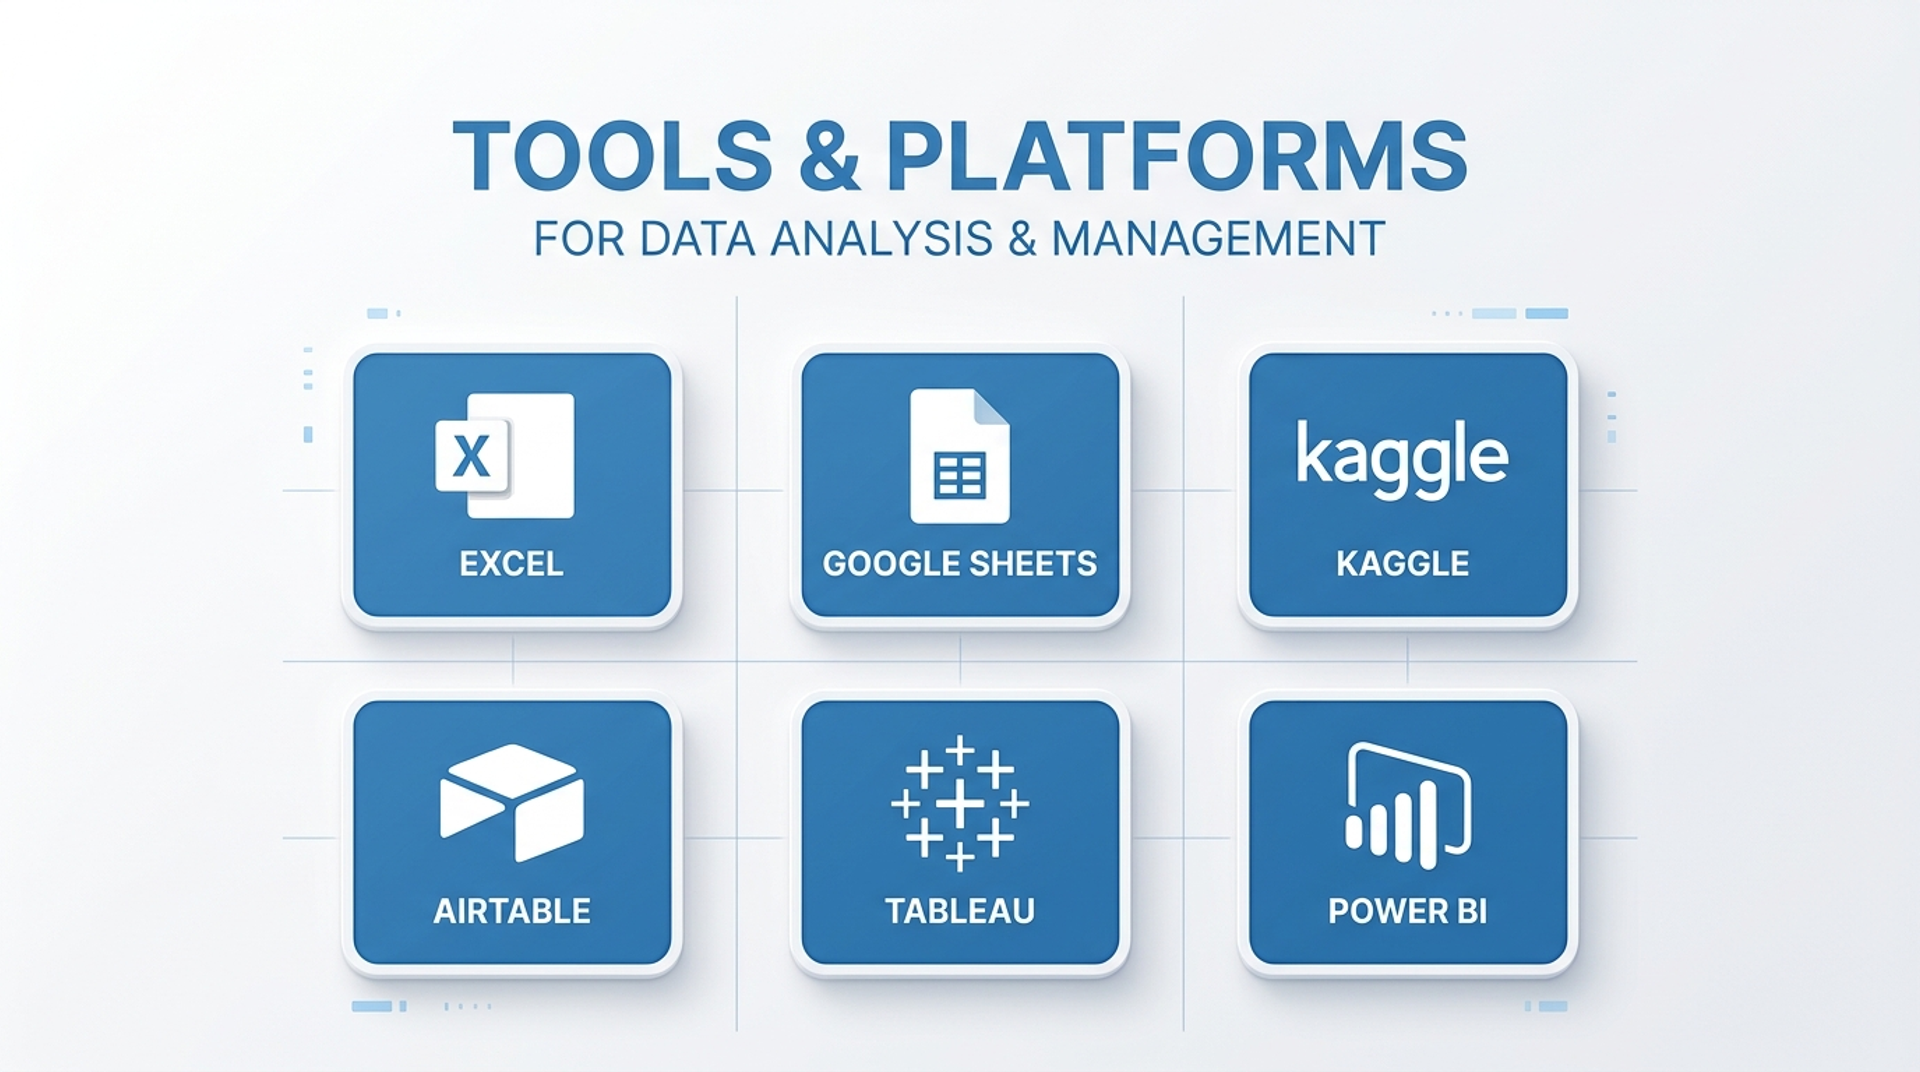
To practice with real data:
To showcase your work:
Save or screenshot this simple 12-week plan:
Week 1–2 → Basics + Functions (IF, SUM, COUNT, VLOOKUP)
Week 3–4 → Pivot Tables + Charts + Formatting
Week 5–6 → Power Query + Data Cleaning
Week 7–8 → Dashboards + Advanced Charts
Week 9–10 → Power Pivot + DAX Basics
Week 11–12 → Build 2 portfolio projects + LinkedIn update
Following this roadmap consistently for 1–2 hours a day is enough to become job-ready within 3 months.
Want this roadmap with resources, practice files, and weekly milestones? Join our beginner-friendly training and get everything in one place.
Q1. Do I need any prior knowledge to learn Excel analytics?
No. If you can use a laptop and navigate basic menus, you can start. The roadmap above begins at zero.
Q2. How long does it realistically take to get job-ready?
Most dedicated learners become interview-ready in 8–12 weeks with consistent daily practice of 1–2 hours.
Q3. Is Excel analytics still relevant when Python and SQL exist? Absolutely.
Most Indian companies especially in BFSI, retail, and operations run their daily reporting on Excel. Excel analytics is also faster to learn and immediately applicable in any role. Python and SQL can come later.
Q4. What kind of jobs can I apply for after learning this?
MIS Executive, Data Analyst, Business Analyst, Operations Analyst, Reporting Analyst, Financial Analyst all actively hiring freshers with strong Excel analytics skills.
Q5. Can I learn this if I'm from a non-technical background?
Yes and you might actually have an advantage. If you come from commerce, management, or even arts, your business understanding combined with Excel analytics is a powerful combination.
Q6. What makes your course different from free YouTube tutorials?
Structure, accountability, and outcomes. Free tutorials give you bits and pieces; our course gives you a proven sequence, real-world projects, doubt-clearing support, and a certificate that adds weight to your resume. See course details here.
The job market in 2026 is not cruel it's just honest. It rewards people who can do things, not just list things. Excel analytics is one of the fastest, most accessible ways to go from "looking for a job" to "getting calls for interviews."
You don't need a fancy degree. You don't need a year of preparation. You need a clear roadmap, the right guidance, and the decision to start today.
Every day you wait, someone else is building the skill you could already have.
The best time to start was last year. The second best time is right now.
Join our Excel Analytics course for beginners and take the first step toward a career that actually pays.

A visionary data scientist dedicated to unlocking the potential of data to drive informed decision-making and spark innovation. With a strong foundation in Data Science.