Power BI vs Tableau: Which Tool Wins in 2026?
A 2026 head-to-head comparison of Power BI and Tableau covering pricing, ease of use, visualizations, integrations, and career demand — helping you pick the right BI tool for your goals.
Power BI and Tableau are the two most in-demand business intelligence tools of 2026. This in-depth guide compares both on pricing, learning curve, data visualization power, cloud integrations, and job market salary helping students, analysts, and professionals make a smart, career-shaping decision.
In today's data-driven world, choosing the right business intelligence (BI) tool can make or break your career as a data analyst, business professional, or aspiring tech expert. Two names consistently dominate the BI landscape in 2026 Power BI and Tableau. Both tools are powerful, widely adopted by Fortune 500 companies, and in high demand by employers globally.
But which one should you learn whether you are a student just starting out, a professional looking to upskill, or a business leader making a strategic technology decision? This comprehensive guide breaks down everything: pricing, ease of use, visualization capabilities, cloud integrations, performance, and real-world career opportunities in 2026. By the end, you will have absolute clarity on which BI tool aligns with your goals.
What Is Power BI?
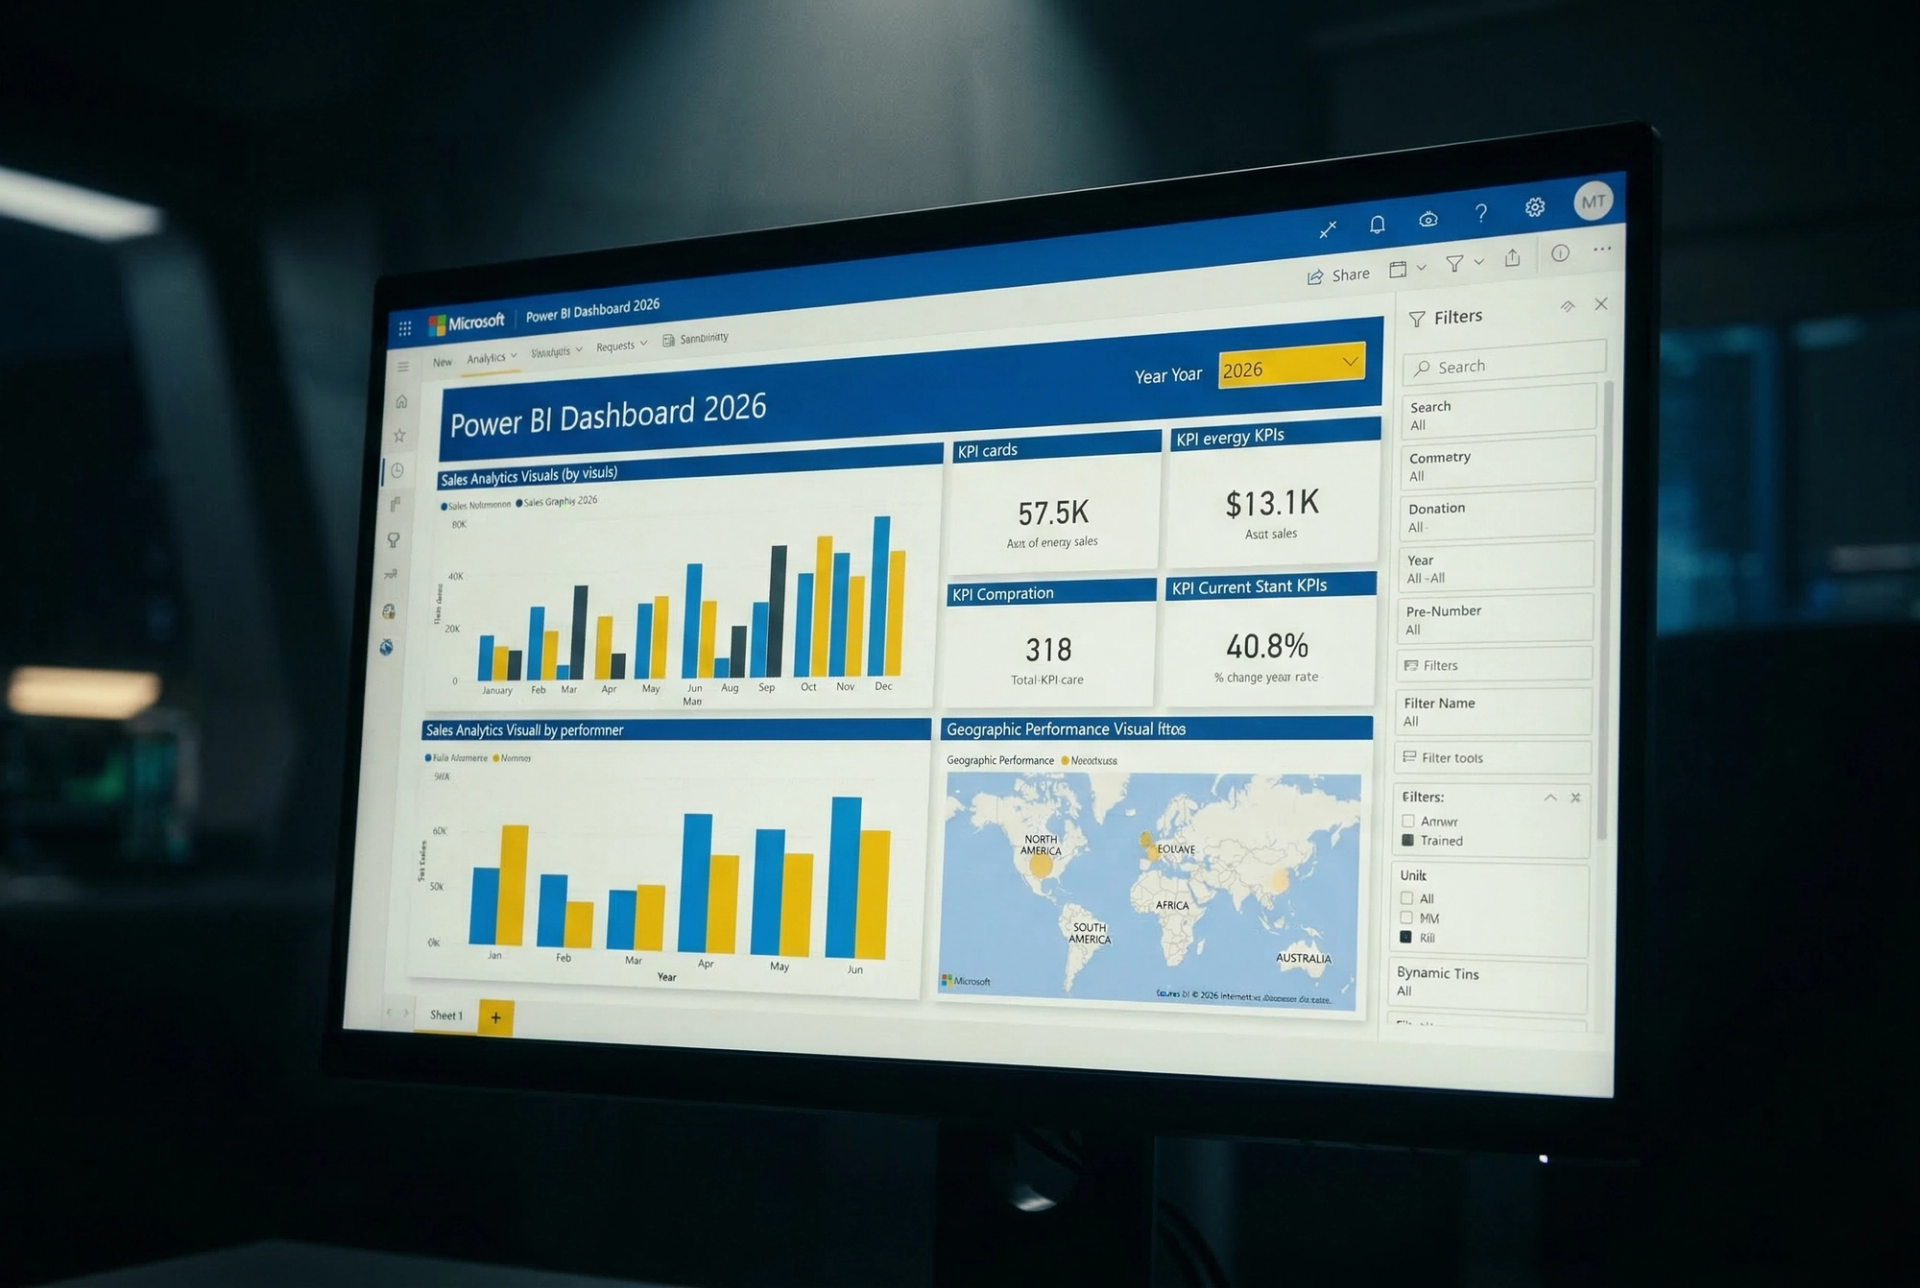
Power BI is Microsoft's flagship business intelligence and data analytics platform. First launched in 2014 as part of the Microsoft Office 365 suite, Power BI has grown into one of the most widely used data visualization tools in the world. It allows users to connect to hundreds of data sources, transform raw data into interactive dashboards, and share insights across teams all within the familiar Microsoft ecosystem.
Power BI comes in three main versions: Power BI Desktop (a free Windows application for creating reports), Power BI Service (the cloud-based platform for sharing and collaboration), and Power BI Mobile (for on-the-go analytics). For enterprises, Power BI Premium offers advanced AI, paginated reports, and dedicated cloud capacity.
Key Strengths of Power BI
- Deep integration with Microsoft 365, Azure, Excel, and Teams
- Affordable pricing — starting at just $10/user/month (Pro plan)
- Strong DAX (Data Analysis Expressions) formula language for advanced calculations
- AI-powered features including natural language Q&A, AutoML, and Copilot integration
- Regular monthly updates with new features pushed directly by Microsoft
- Massive community support, free learning resources, and Microsoft Learn paths
If your organization already uses Microsoft products, Power BI integrates seamlessly without any additional infrastructure cost — making it an excellent choice for businesses of all sizes.
What Is Tableau?
Tableau was founded in 2003 by researchers from Stanford University with a mission to help people see and understand their data. Acquired by Salesforce in 2019 for $15.7 billion, Tableau is today one of the most respected and powerful data visualization platforms in the enterprise world. It is celebrated for its drag-and-drop simplicity, stunning visual output, and its ability to handle extremely large and complex datasets with ease.
Tableau's product line includes Tableau Desktop (the full-featured authoring tool), Tableau Server (for on-premise publishing), Tableau Cloud (fully managed SaaS solution), and Tableau Public (a free version for data enthusiasts). With Salesforce's backing, Tableau has also integrated Einstein AI for predictive analytics and natural language queries.
Key Strengths of Tableau
- Best-in-class data visualization with pixel-perfect, publication-quality charts
- Drag-and-drop interface that requires no coding knowledge to get started
- Handles large datasets efficiently using its in-memory VizQL engine
- Powerful calculated fields and Level of Detail (LOD) expressions
- Strong Salesforce CRM integration and Einstein AI features
- Tableau Public is a free platform to showcase work and build a portfolio
Tableau is the go-to tool for organizations that prioritize visual storytelling, advanced analytics, and enterprise-grade data governance.
Power BI vs Tableau Quick Comparison at a Glance
Before diving deeper, here is a snapshot of both tools across all major parameters:
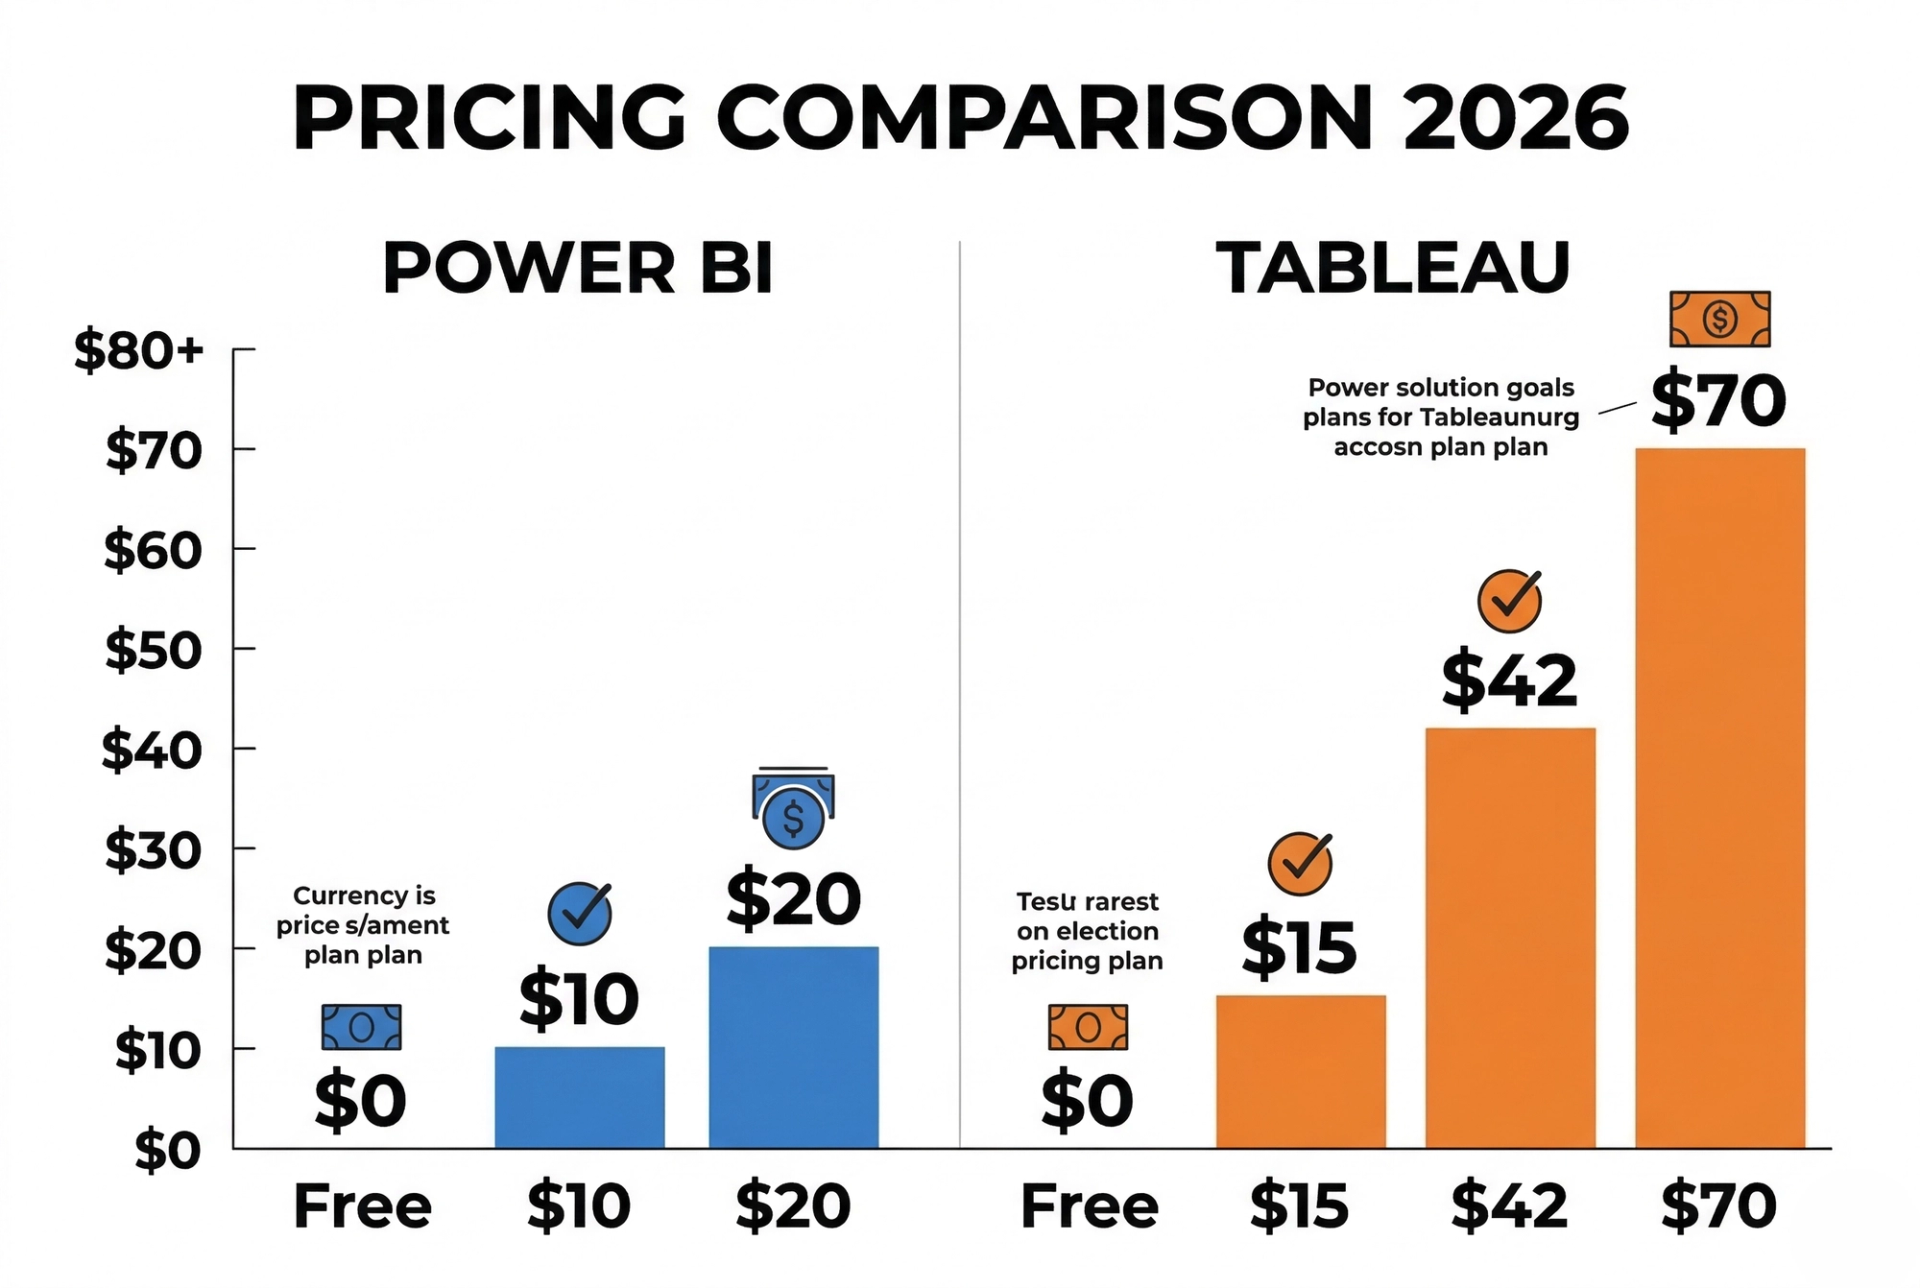
Pricing Comparison Which Tool Is More Affordable?
When it comes to pricing, Power BI clearly wins for budget-conscious users, organizations, and students. Tableau, while premium in price, delivers enterprise-level capabilities that often justify the investment for large corporations.
Power BI Pricing
- Power BI Desktop : FREE (Windows only)
- Power BI Pro : $10/user/month (report sharing and collaboration)
- Power BI Premium Per User (PPU) : $20/user/month (advanced AI, bigger datasets)
- Power BI Premium Capacity : from $4,995/month (large enterprise deployments)
- Power BI Embedded : Pay-as-you-go via Azure (for developers)
Tableau Pricing
- Tableau Public : FREE (all data is publicly visible not for private business use)
- Tableau Creator : $70/user/month (full authoring + Tableau Desktop + Cloud)
- Tableau Explorer : $42/user/month (analysis only, no publishing)
- Tableau Viewer : $15/user/month (view and interact only)
- Tableau Server (On-Premise) : Custom enterprise pricing
Pricing Verdict: Power BI wins decisively on affordability. At $10/user/month vs Tableau's $70/user/month (Creator plan), Power BI is 7x more cost-effective for most organizations. For students and small businesses, Power BI Desktop is completely free. Tableau's higher cost is justified for enterprises needing advanced visual analytics at scale.
Ease of Use Which Is Better for Beginners?
Power BI is generally considered more beginner-friendly, especially for anyone already familiar with Microsoft products like Excel, Word, or Outlook. The user interface is intuitive, and the drag-and-drop report builder makes it easy to create charts, tables, and dashboards without any prior programming knowledge.
The learning curve for Power BI's DAX (Data Analysis Expressions) language can be challenging for complex calculations, but the tool is designed so that beginners can be productive within days. Microsoft also offers free learning paths on Microsoft Learn, making it accessible for everyone.
Tableau also features a drag-and-drop interface, but it has a slightly steeper learning curve due to its powerful feature set. Concepts like Level of Detail (LOD) expressions, data blending, and table calculations require time and practice to master. However, Tableau's visual feedback is instantaneous you can see chart changes in real time as you drag fields, which makes exploration feel natural and exciting.
Ease of Use Side by Side
- Power BI: Excel-like experience, familiar ribbon UI, easier for Microsoft users
- Tableau: Highly visual and interactive, but complex features require dedicated learning
- Both tools offer free training resources, YouTube tutorials, and active community forums
Ease of Use Verdict: For absolute beginners, Power BI is easier to start with. For visual exploration and data storytelling, Tableau's drag-and-drop feels more dynamic. Both tools require approximately 3–6 months of dedicated practice to reach proficiency. Recommended: Start with Power BI for quicker wins, then advance to Tableau for enterprise roles.
Data Visualization Capabilities Who Creates Better Dashboards?
Data visualization is the heart of both tools. If your job is to tell compelling stories with data, this comparison matters the most.
Power BI Visualizations
Power BI offers over 30 built-in visualization types including bar charts, line graphs, pie charts, scatter plots, maps, treemaps, funnels, KPI cards, and more. It also has a custom visuals marketplace (AppSource) with hundreds of third-party visuals that can be imported for free or at a cost. The new Power BI Copilot (powered by GPT-4) allows users to simply type a question like "Show me sales by region for 2025" and get an instant chart making advanced analytics accessible to everyone.
Tableau Visualizations
Tableau is widely recognized as the gold standard in data visualization. It supports virtually every chart type imaginable including advanced visuals like bump charts, Sankey diagrams, hex maps, and custom shapes. Tableau's VizQL engine renders charts at incredible speed even on large datasets. The level of visual control in Tableau is unmatched every color, size, font, and axis can be fine-tuned to the pixel level.
- Power BI: Great for standard business dashboards, KPIs, and operational reports
- Tableau: Ideal for complex data storytelling, publication-quality visuals, and deep exploratory analysis
- Both support geographic maps, real-time data connections, and interactive filters
Visualization Verdict: Tableau wins on visual quality and flexibility. Power BI wins on AI-powered chart generation and Office 365 integration. For standard business reports, Power BI is more than sufficient. For advanced, publication-quality visual analytics, Tableau is the clear winner.

Integration and Data Connectivity
Data integration determines how well a BI tool connects to your existing data ecosystem — databases, cloud services, spreadsheets, APIs, and more.
Power BI Integrations
- Native Microsoft ecosystem: Excel, SharePoint, Teams, Dynamics 365, Azure Synapse
- Cloud connectors: Snowflake, Amazon Redshift, Google Big Query, Databricks
- Databases: MySQL, PostgreSQL, Oracle, SQL Server, SAP HANA
- APIs and web services via REST connectors and Power Query (M language)
- Real-time streaming data from IoT sensors and Azure Event Hubs
- Microsoft Fabric the 2026 unified analytics and lakehouse platform
Tableau Integrations
- Salesforce CRM, Einstein Analytics, and Tableau CRM seamless native integration
- Cloud databases: Google Big Query, Amazon Redshift, Snowflake, Azure Synapse
- Databases: MySQL, PostgreSQL, Oracle, Teradata, Hadoop, Apache Spark
- Google Sheets, Excel, JSON, PDF, Spatial files, Statistical files (R, SAS)
- REST API and Web Data Connector (WDC) for custom data sources
- Native Python and R integration for advanced statistical analysis
Both tools support an impressive range of data sources. However, for organizations running Microsoft-based infrastructure, Power BI's native Azure and Office 365 integration gives it a significant edge. For Salesforce-driven organizations and those needing Python/R statistical integration, Tableau takes the lead.
Performance and Scalability
As data volumes grow in 2026, performance and scalability have become critical evaluation criteria.
Power BI uses an in-memory columnar database engine called VertiPaq. It compresses data efficiently before loading it into memory, which allows fast querying on millions of rows. Power BI's Direct Query mode also allows live connections to databases without importing data — suitable for very large enterprise datasets. With Microsoft Fabric (widely adopted by 2026), Power BI is now part of a unified lake house architecture, making it more scalable than ever for big data workloads.
Tableau uses its proprietary VizQL (Visual Query Language) engine that translates drag-and-drop interactions into database queries in real time. Tableau handles large and complex data extremely well, especially with its Hyper engine a high-performance in-memory data engine that extracts and processes data at record speeds. Tableau is often chosen for enterprise-scale analytics where billions of rows need to be explored interactively.
⚡ Performance Verdict: Power BI excels for mid-to-large datasets, especially with Azure and One Lake integration. Tableau is superior for complex, exploratory analysis on extremely large datasets. For most business analysts and students, both tools perform very well on typical workloads.
9. Career Scope and Job Market in 2026
This is often the most important section for students and professionals. Which tool will help you get hired faster, earn a higher salary, and future-proof your career?
Power BI Job Market in 2026
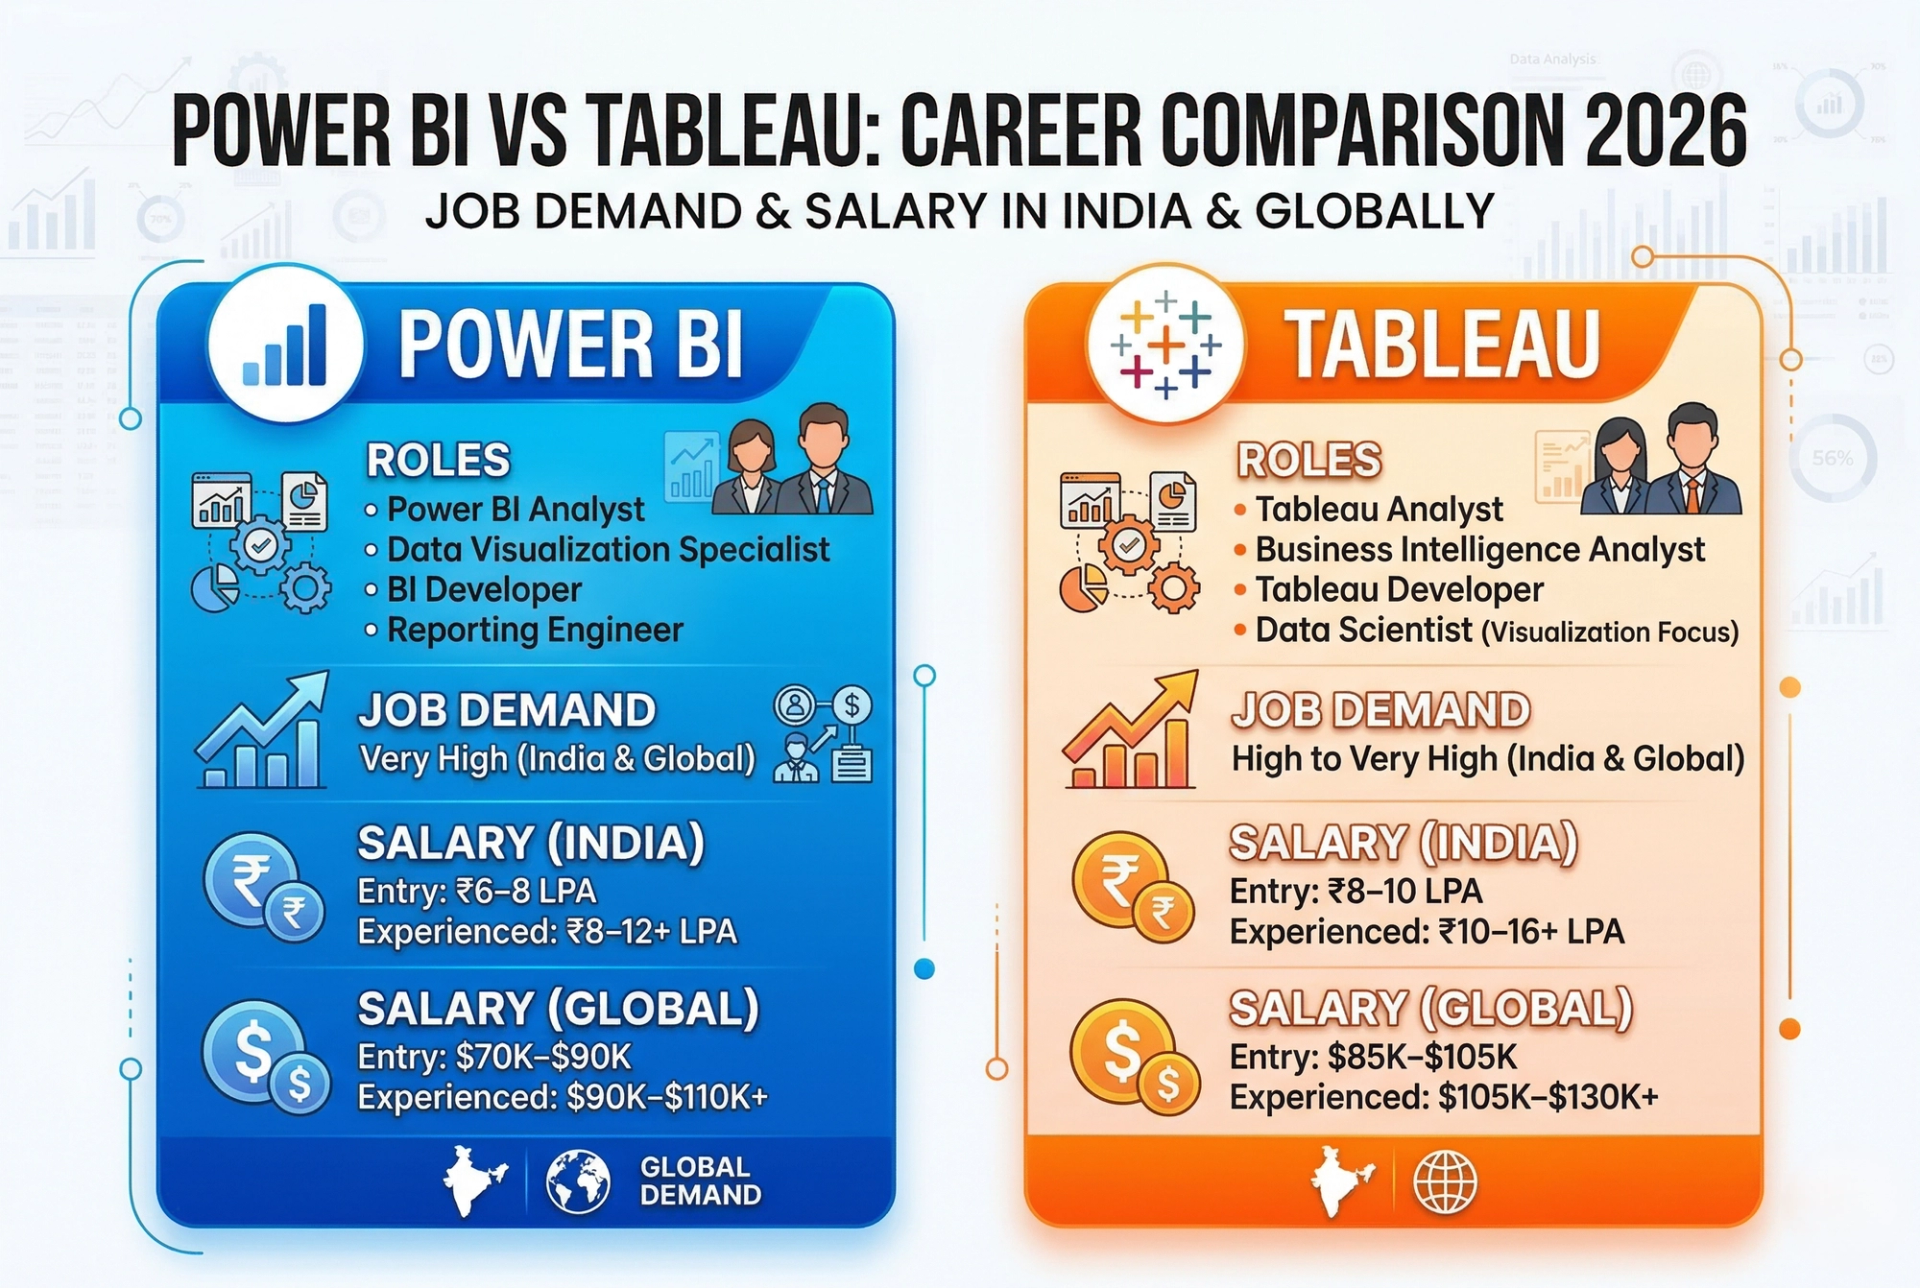
Power BI is the most searched BI skill on LinkedIn and Naukri.com in India in 2026. Companies across banking, retail, manufacturing, healthcare, and IT services actively hire Power BI professionals. The Microsoft PL-300 certification (Power BI Data Analyst) is highly recognized and relatively affordable to obtain.
- Job Titles: Power BI Developer, BI Analyst, Data Analyst, MIS Analyst, Reporting Analyst
- Average Salary in India: ₹6–12 LPA (fresher to mid-level)
- Average Salary Globally: $70,000–$110,000/year (US market)
- Top Hirers: TCS, Infosys, Wipro, Accenture, KPMG, banks, insurance firms, and startups
Tableau Job Market in 2026
Tableau remains the preferred tool in MNCs, global consulting firms, and data-driven enterprises. Tableau professionals typically command higher salaries due to the tool's complexity and higher enterprise value. The Tableau Desktop Specialist and Tableau Certified Data Analyst certifications are globally recognized.
- Job Titles: Tableau Developer, Senior BI Analyst, Data Visualizer, Analytics Engineer
- Average Salary in India: ₹8–16 LPA (mid to senior level)
- Average Salary Globally: $85,000–$130,000/year (US market)
- Top Hirers: Deloitte, PwC, EY, Google, Amazon, global banks, FMCG companies
10. Power BI vs Tableau Which One Should You Choose?
Pro tip from industry experts: Learn Power BI Training Course first to land your first BI job quickly, then add our Tableau Training Course to your skill set to unlock premium, high-salary roles. You can explore the full learning path through our Advanced Data Analytics Program or browse all Business Intelligence Courses. For teams and organizations, our Custom Training Services can be tailored to your exact requirements.
Having proficiency in both tools makes you a highly sought-after dual-certified BI professional in 2026.
Frequently Asked Questions (FAQs)
Q1. Is Power BI easier to learn than Tableau?
Yes, Power BI is generally easier for beginners — especially those familiar with Microsoft Excel. Its ribbon-style interface, drag-and-drop report builder, and affordable pricing make it the first choice for beginners. Tableau has a slightly steeper learning curve due to its advanced features, but is very intuitive for visual exploration once you get started.
Q2. Which tool is better for getting a job in India in 2026?
Power BI has more job listings in India in 2026, particularly in IT services, banking, retail, and BFSI sectors. If you want a faster entry into the job market, start with Power BI. Tableau is preferred by MNCs and global firms and typically offers higher salaries at the mid and senior level.
Q3. Can I use both Power BI and Tableau together?
Technically yes, though organizations typically choose one as their primary BI platform. Many professionals learn both tools to maximize their career opportunities. Having dual certification in Power BI (PL-300) and Tableau (Desktop Specialist) is a strong competitive advantage in 2026.
Q4. Is there a free version of Power BI and Tableau?
Yes. Power BI Desktop is completely free to download and use for report creation (Windows only). Tableau Public is free but all published work is publicly visible and cannot be used for private business data. For private, collaborative work, both tools require paid subscriptions.
Q5. Which tool has better AI features in 2026?
Power BI has integrated Microsoft Copilot (GPT-4 powered) for natural language queries, auto-chart generation, and AI-driven insights. Tableau has Einstein AI (Salesforce) with Ask Data, Explain Data, and predictive features. Both are excellent, but Power BI's Copilot integration is more accessible and easier to use for everyday analysts in 2026.
Q6. What certifications should I pursue for Power BI and Tableau?
For Power BI, the Microsoft PL-300 (Power BI Data Analyst Associate) is the most recognized certification. For Tableau, start with the Tableau Desktop Specialist, then advance to Tableau Certified Data Analyst. Both certifications are internationally recognized and significantly boost your earning potential.
Q7. Which tool is better for data science professionals?
Tableau integrates natively with Python and R, making it a preferred choice for data scientists who need advanced statistical modeling alongside visualization. Power BI also supports Python and R scripts, but Tableau's integration is more mature and widely used in academic and research environments.
Conclusion
After a thorough comparison across pricing, ease of use, data visualization, integrations, performance, and career opportunities — here is the honest final verdict for 2026: there is no one-size-fits-all answer. Both Power BI and Tableau are exceptional tools, and the right choice depends entirely on your situation.
Power BI wins on affordability, Microsoft ecosystem integration, and beginner accessibility. It is the best choice for students entering the job market, small-to-medium businesses, and organizations running on Microsoft infrastructure. With Copilot AI and Microsoft Fabric, Power BI is rapidly evolving into a full-stack data analytics platform that goes far beyond simple reporting.
Tableau wins on visual excellence, enterprise-scale analytics, and depth of data exploration. It is the preferred tool for senior data professionals, consultants, and organizations that demand the highest-quality visual narratives from their data. Tableau's Salesforce integration and Einstein AI make it a powerful choice for CRM-driven analytics in 2026.
Our recommendation: Start with Power BI to build a strong foundation in BI and land your first role quickly. As you advance, add Tableau to your toolkit to position yourself for premium, high-impact roles. The data analytics industry in 2026 rewards professionals who are versatile and mastering both tools puts you firmly in the top tier of the BI workforce.
At Cinute Digital (CDPL), we offer industry-leading, job-guaranteed training in both Power BI and Tableau with live projects, expert mentors, and 100% placement support. Whether you are a fresher or an experienced professional, we have a program tailored to accelerate your career in the world of business intelligence and data analytics.
Tags

Seasoned Business Intelligence and learning and development professional with over 11 years of experience empowering students and professionals to unlock career success through data-driven skills. Specializing in Power BI, Tableau, and Prompt Engineering, Ashish is known for delivering practical, high-impact workshops and training programs across academic and corporate sectors.