
How to Create a Pivot Table in Excel (Sales Data Examples)
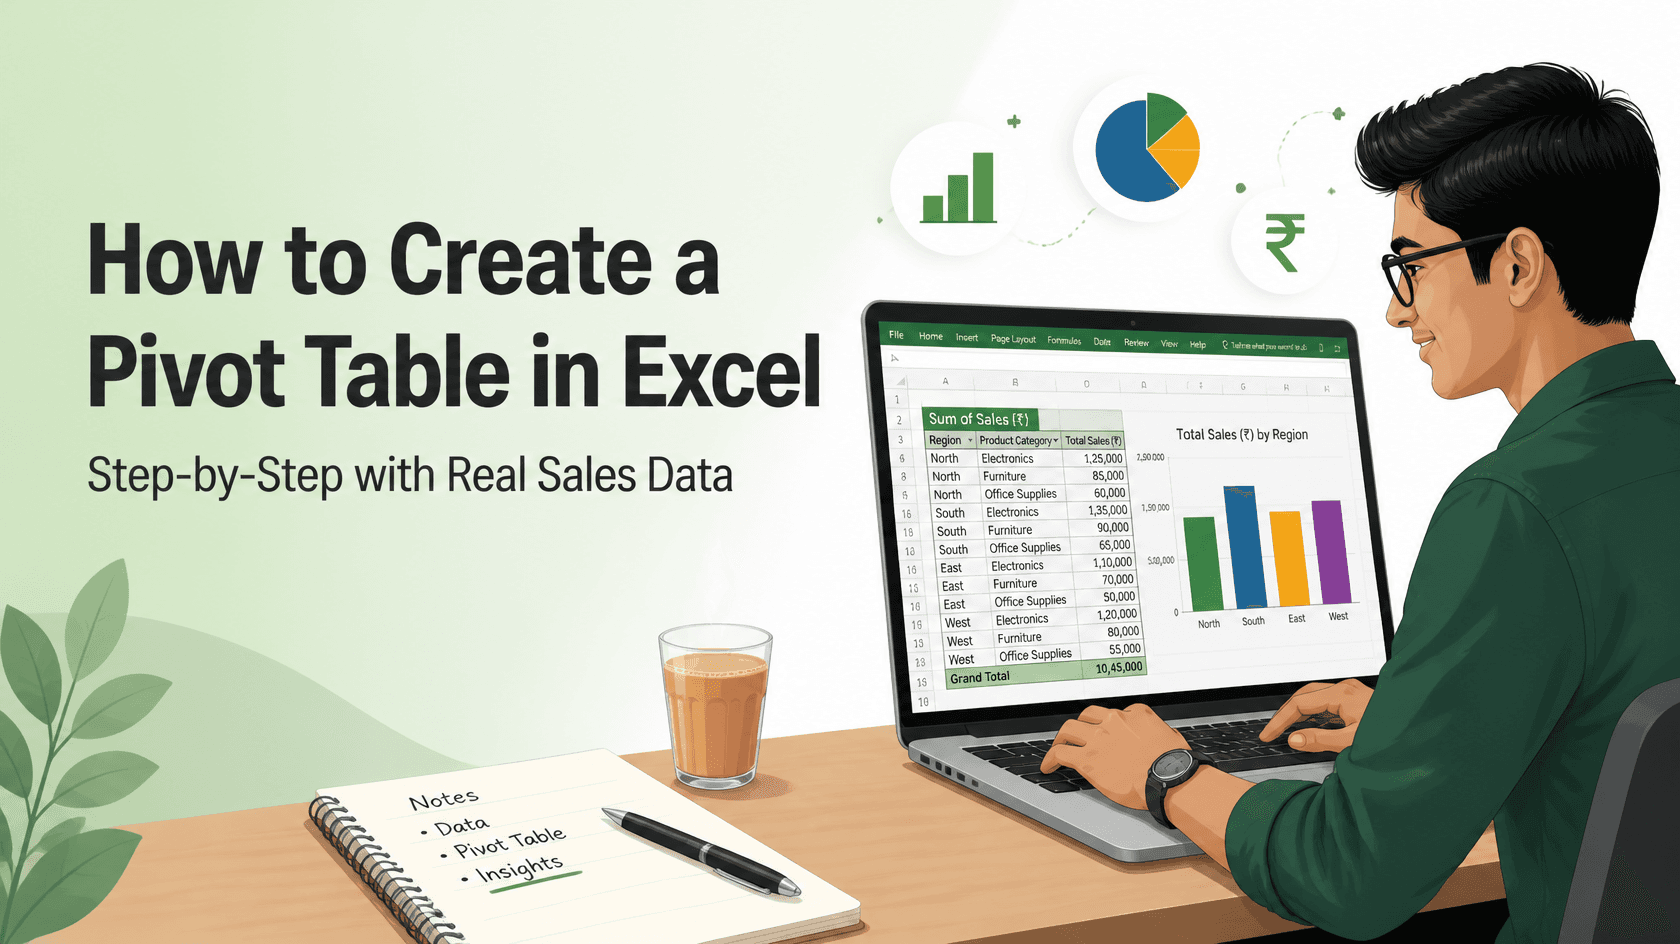
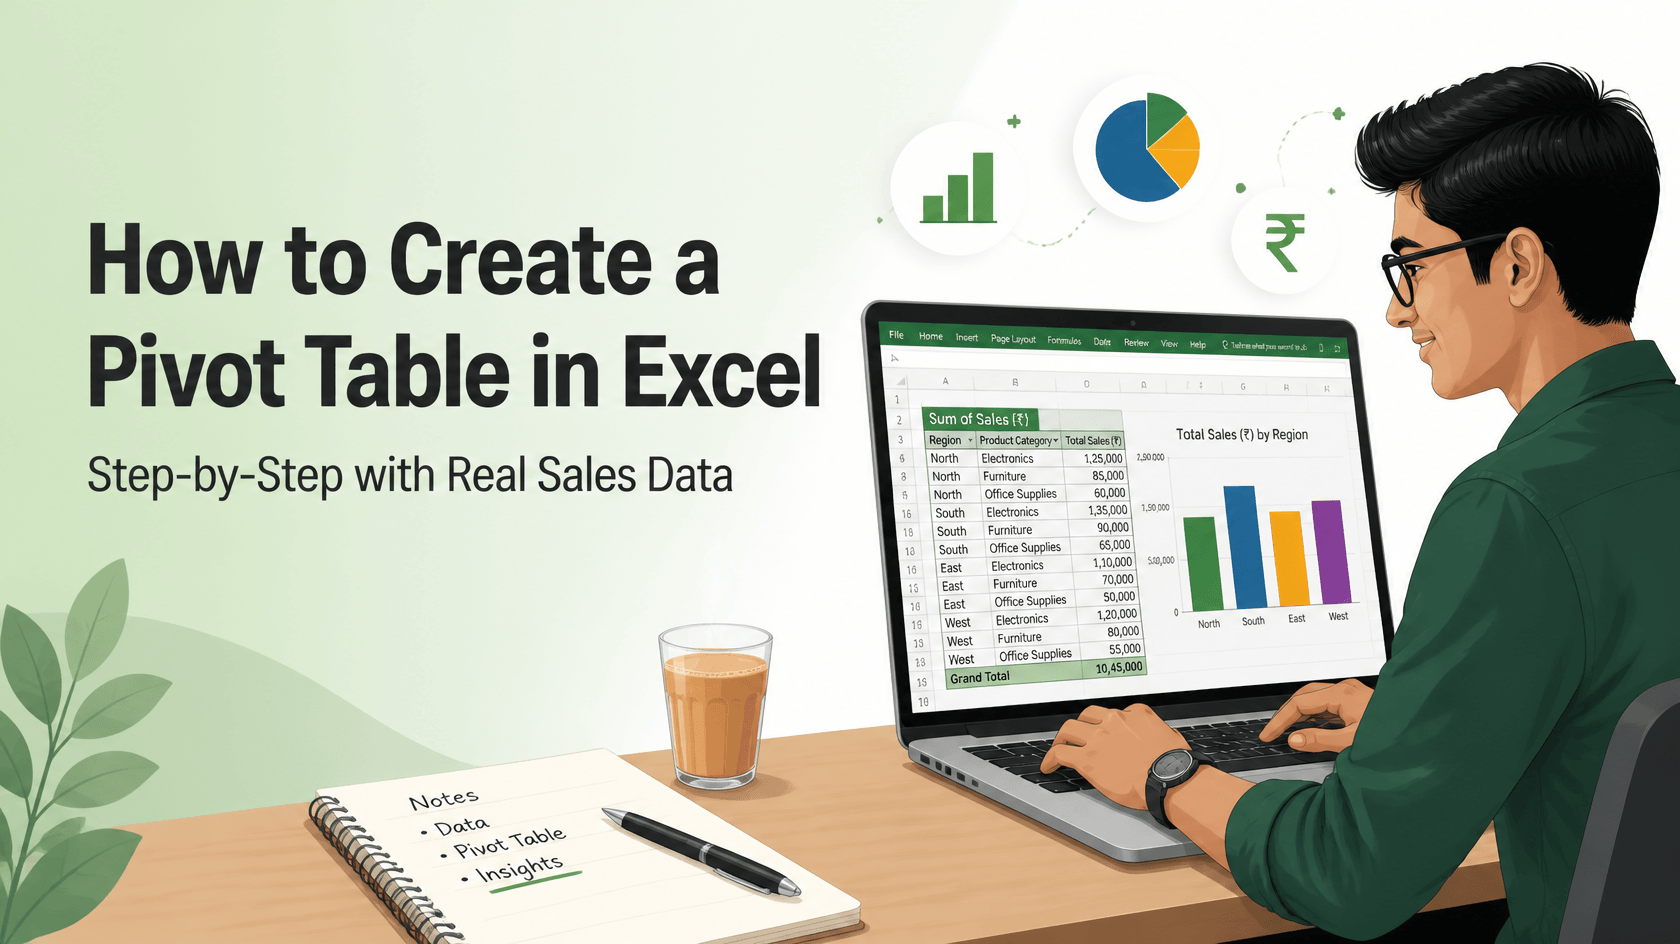
Learn how to create a pivot table in Excel using a realistic Indian sales dataset. This Excel pivot table tutorial walks you through revenue by region, product mix and monthly trends, step by step. It also shows why pivot tables appear in so many fresher job descriptions.
Turn 12 rows of raw sales data into four clear business answers without writing a single formula. A beginner-friendly walkthrough for freshers.
Picture this. You have cleared the aptitude round for an MIS executive role at a distribution company in Andheri. The interviewer turns a laptop towards you. On screen is an Excel sheet with thousands of sales orders. "Tell me which region sold the most last quarter. You have five minutes."
Most freshers start scrolling, filtering and adding numbers by hand. The candidate who can build a pivot table in Excel finishes in a minute and spends the rest of the time explaining what the numbers mean.
This guide closes that gap. You will take a small, realistic sales dataset and build four reports from it: revenue by region, region by product, the monthly trend and each region's share of the total. You will also see why recruiters keep asking for this skill, which mistakes trip up beginners and where it fits in a data career.
This walkthrough comes from the training team at Cinute Digital in Mumbai. It is written for one reader: the fresher who wants Excel to feel like a strength, not a fear.
Open Excel, and let's turn 12 rows of sales data into real answers.
To create a pivot table in Excel, click any cell in your data, go to Insert > PivotTable, choose New Worksheet and click OK. Then drag a category field, such as Region, into Rows and a number field, such as Revenue, into Values. Excel instantly summarises the totals for you.
What Is a Pivot Table in Excel?
A pivot table is an Excel tool that summarises a large table into a short report without formulas. You decide what to group by and what to add up. Excel does the counting, adding and averaging.
The word "pivot" means to rotate. You can move a field from rows to columns in one drag and look at the same data from a new angle. Nothing in your original data changes. The pivot table is only a view of it.
Here is an everyday way to picture it. Think of a kirana store owner at month-end with a register of every sale. If you ask, "How much rice did you sell this month?", he has to flip through every page. A pivot table is like a sharp assistant who reads the whole register and hands over a neat summary: by product, by week or by customer. Ask a different question, and the assistant redoes the summary in seconds.
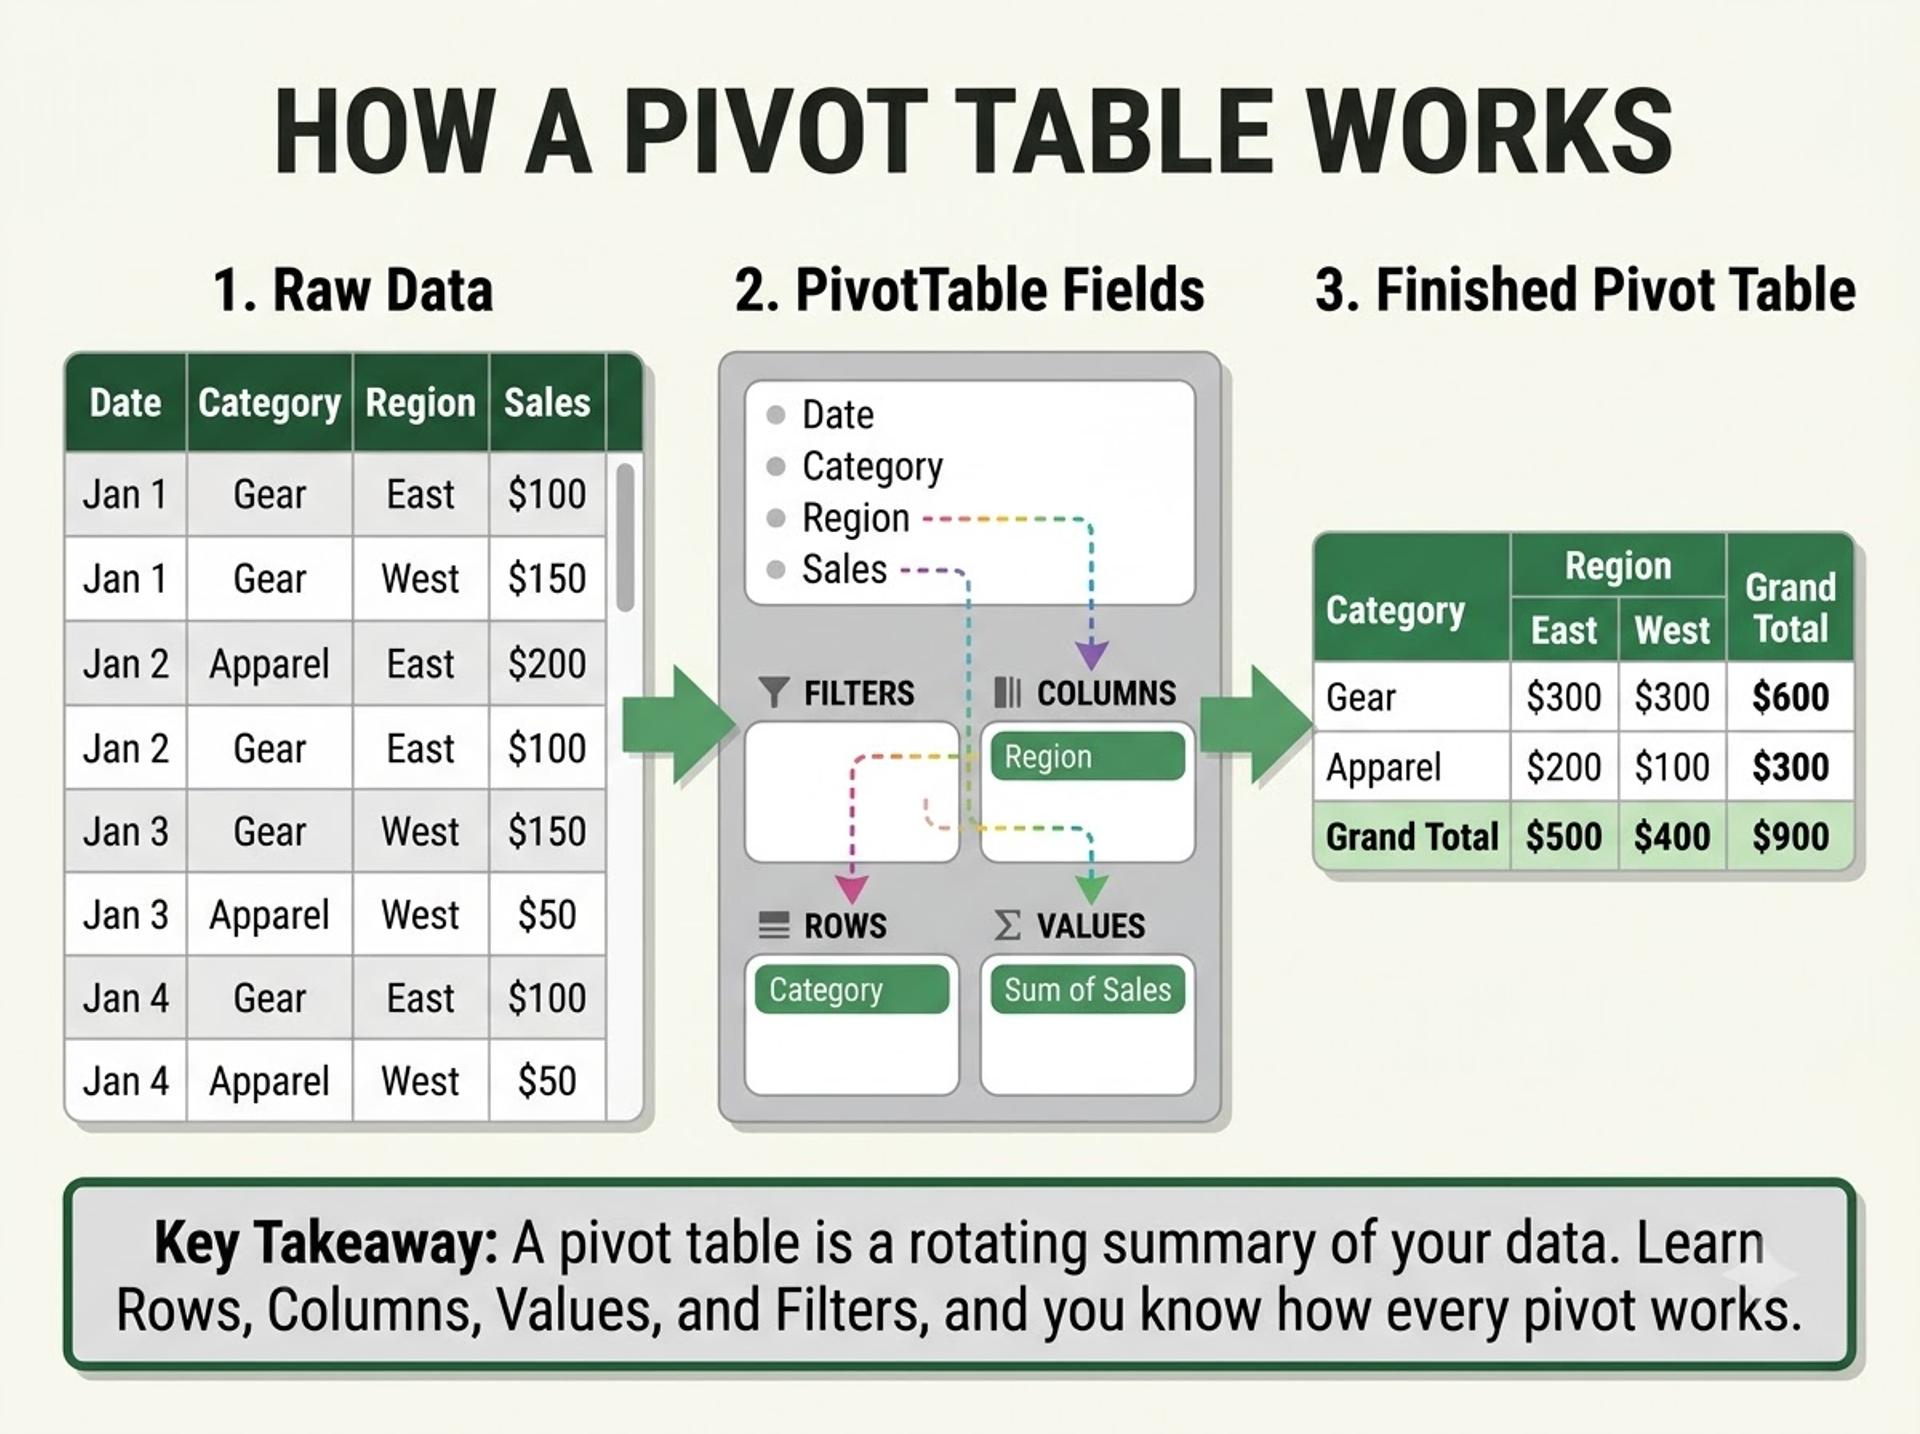
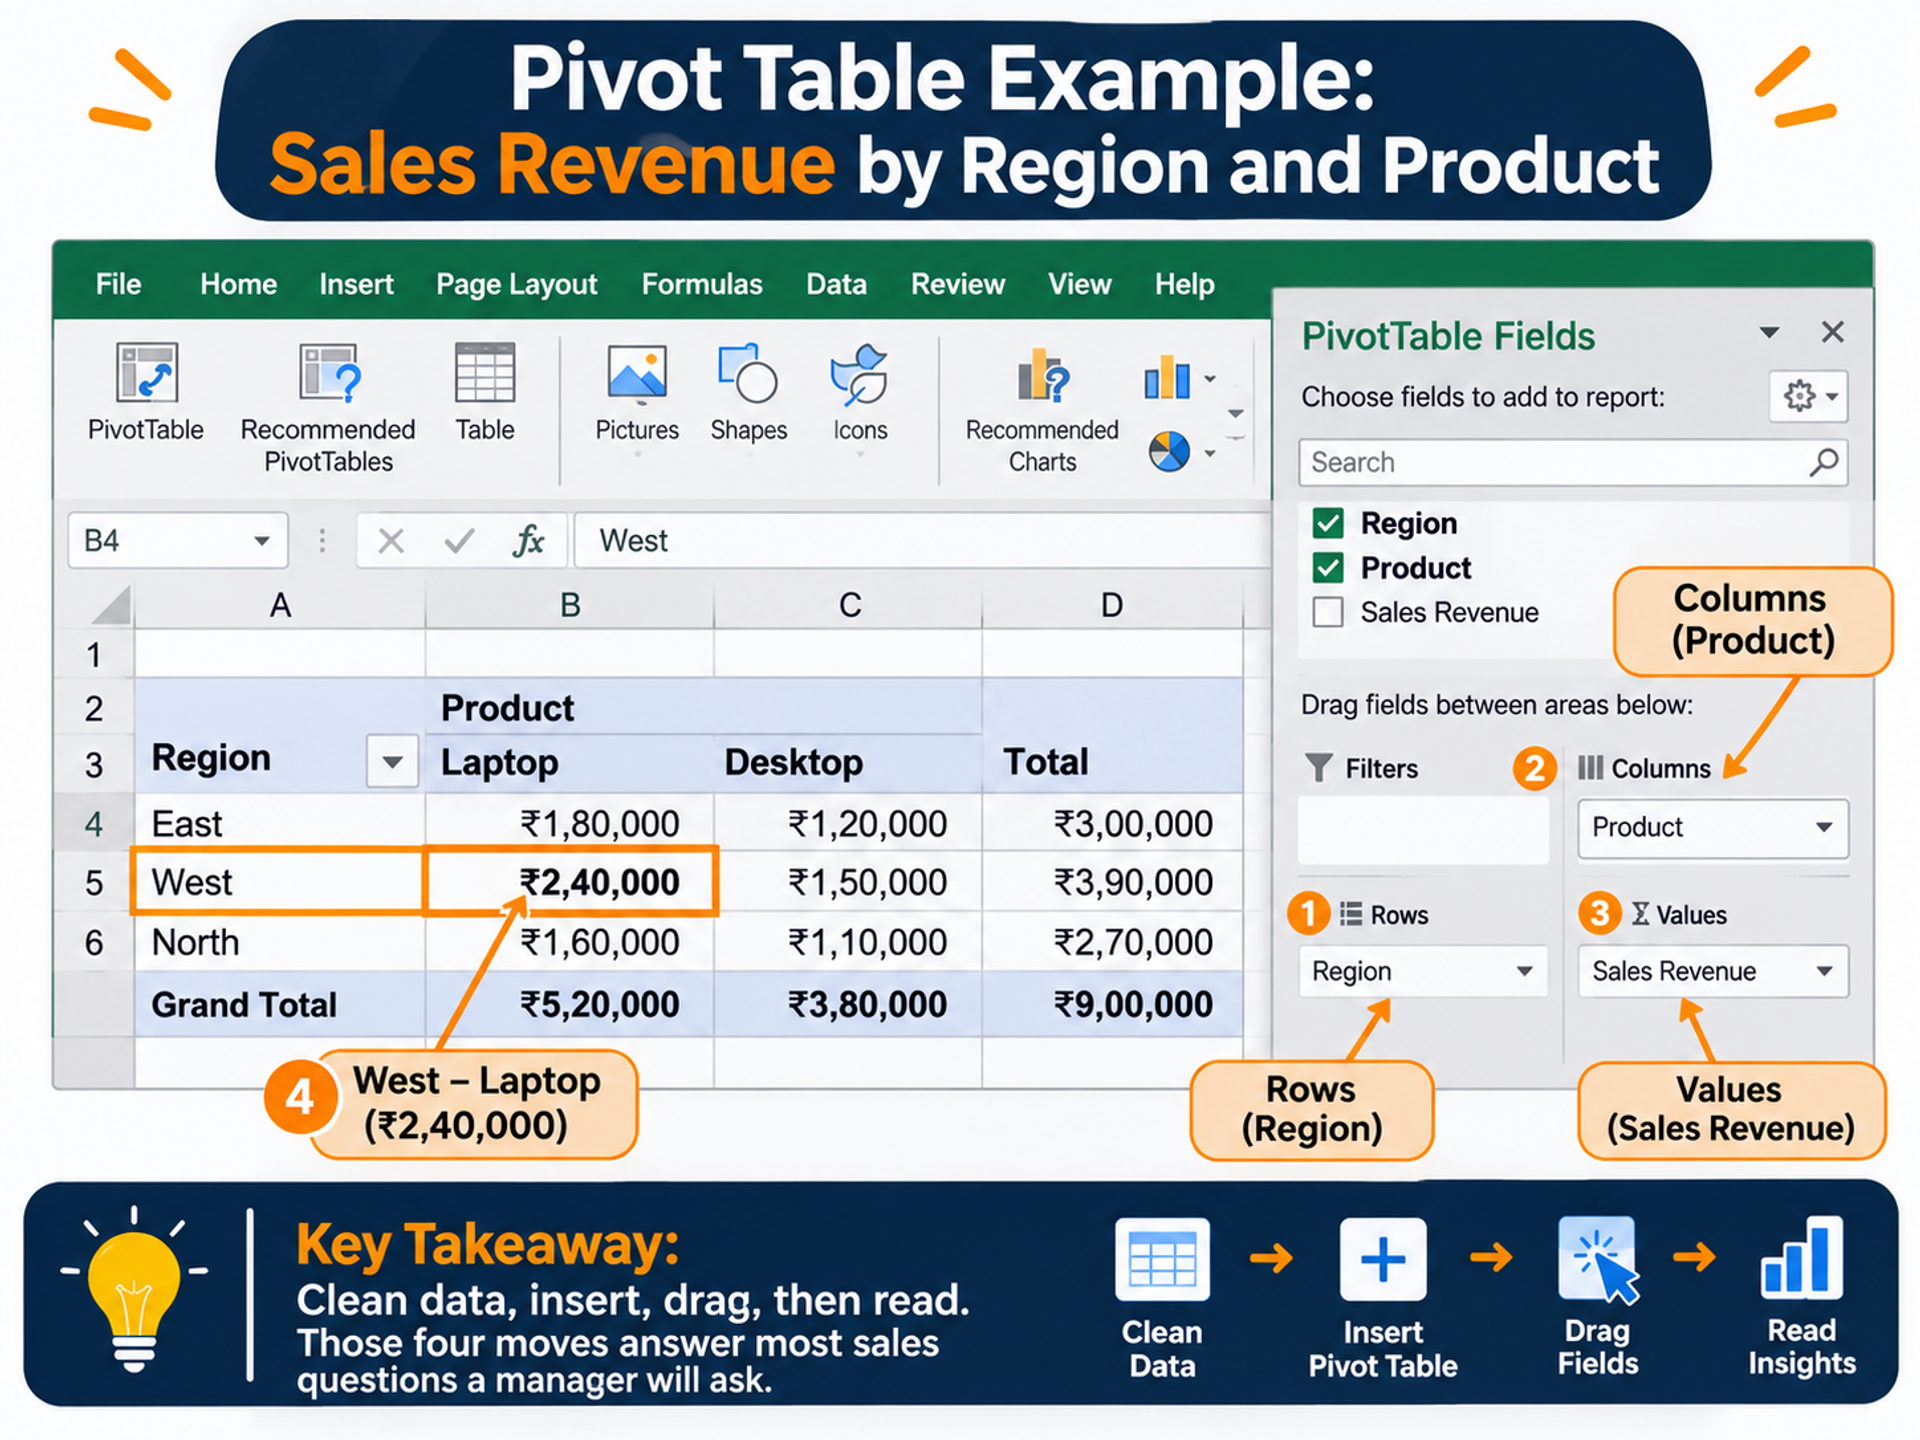
Every pivot table is built from four areas in the PivotTable Fields pane:
- Rows: the categories listed down the left side (for example, Region).
- Columns: the categories listed across the top (for example, Product).
- Values: the numbers you want summarised (for example, Sum of Revenue).
- Filters: a control that limits the whole report (for example, only March).
That is the complete mental model. Every pivot table example you will meet, however large, is just a different arrangement of these four boxes.
Pivot tables are also forgiving. If you put a field in the wrong area, drag it out and try again. You cannot break your data, which makes this the perfect pivot table for beginners exercise: experiment freely.
If you prefer guided practice to trial and error, an Excel for data analytics course takes you from these basics to charts and visual reports with structured exercises.
Why Pivot Tables Matter for Freshers in 2026
Python and AI tools get the headlines, but Excel is still the everyday language of business data in India. Sales teams, finance departments, logistics firms and BPO operations run daily and weekly reports in spreadsheets. Pivot tables are how those reports get built quickly.
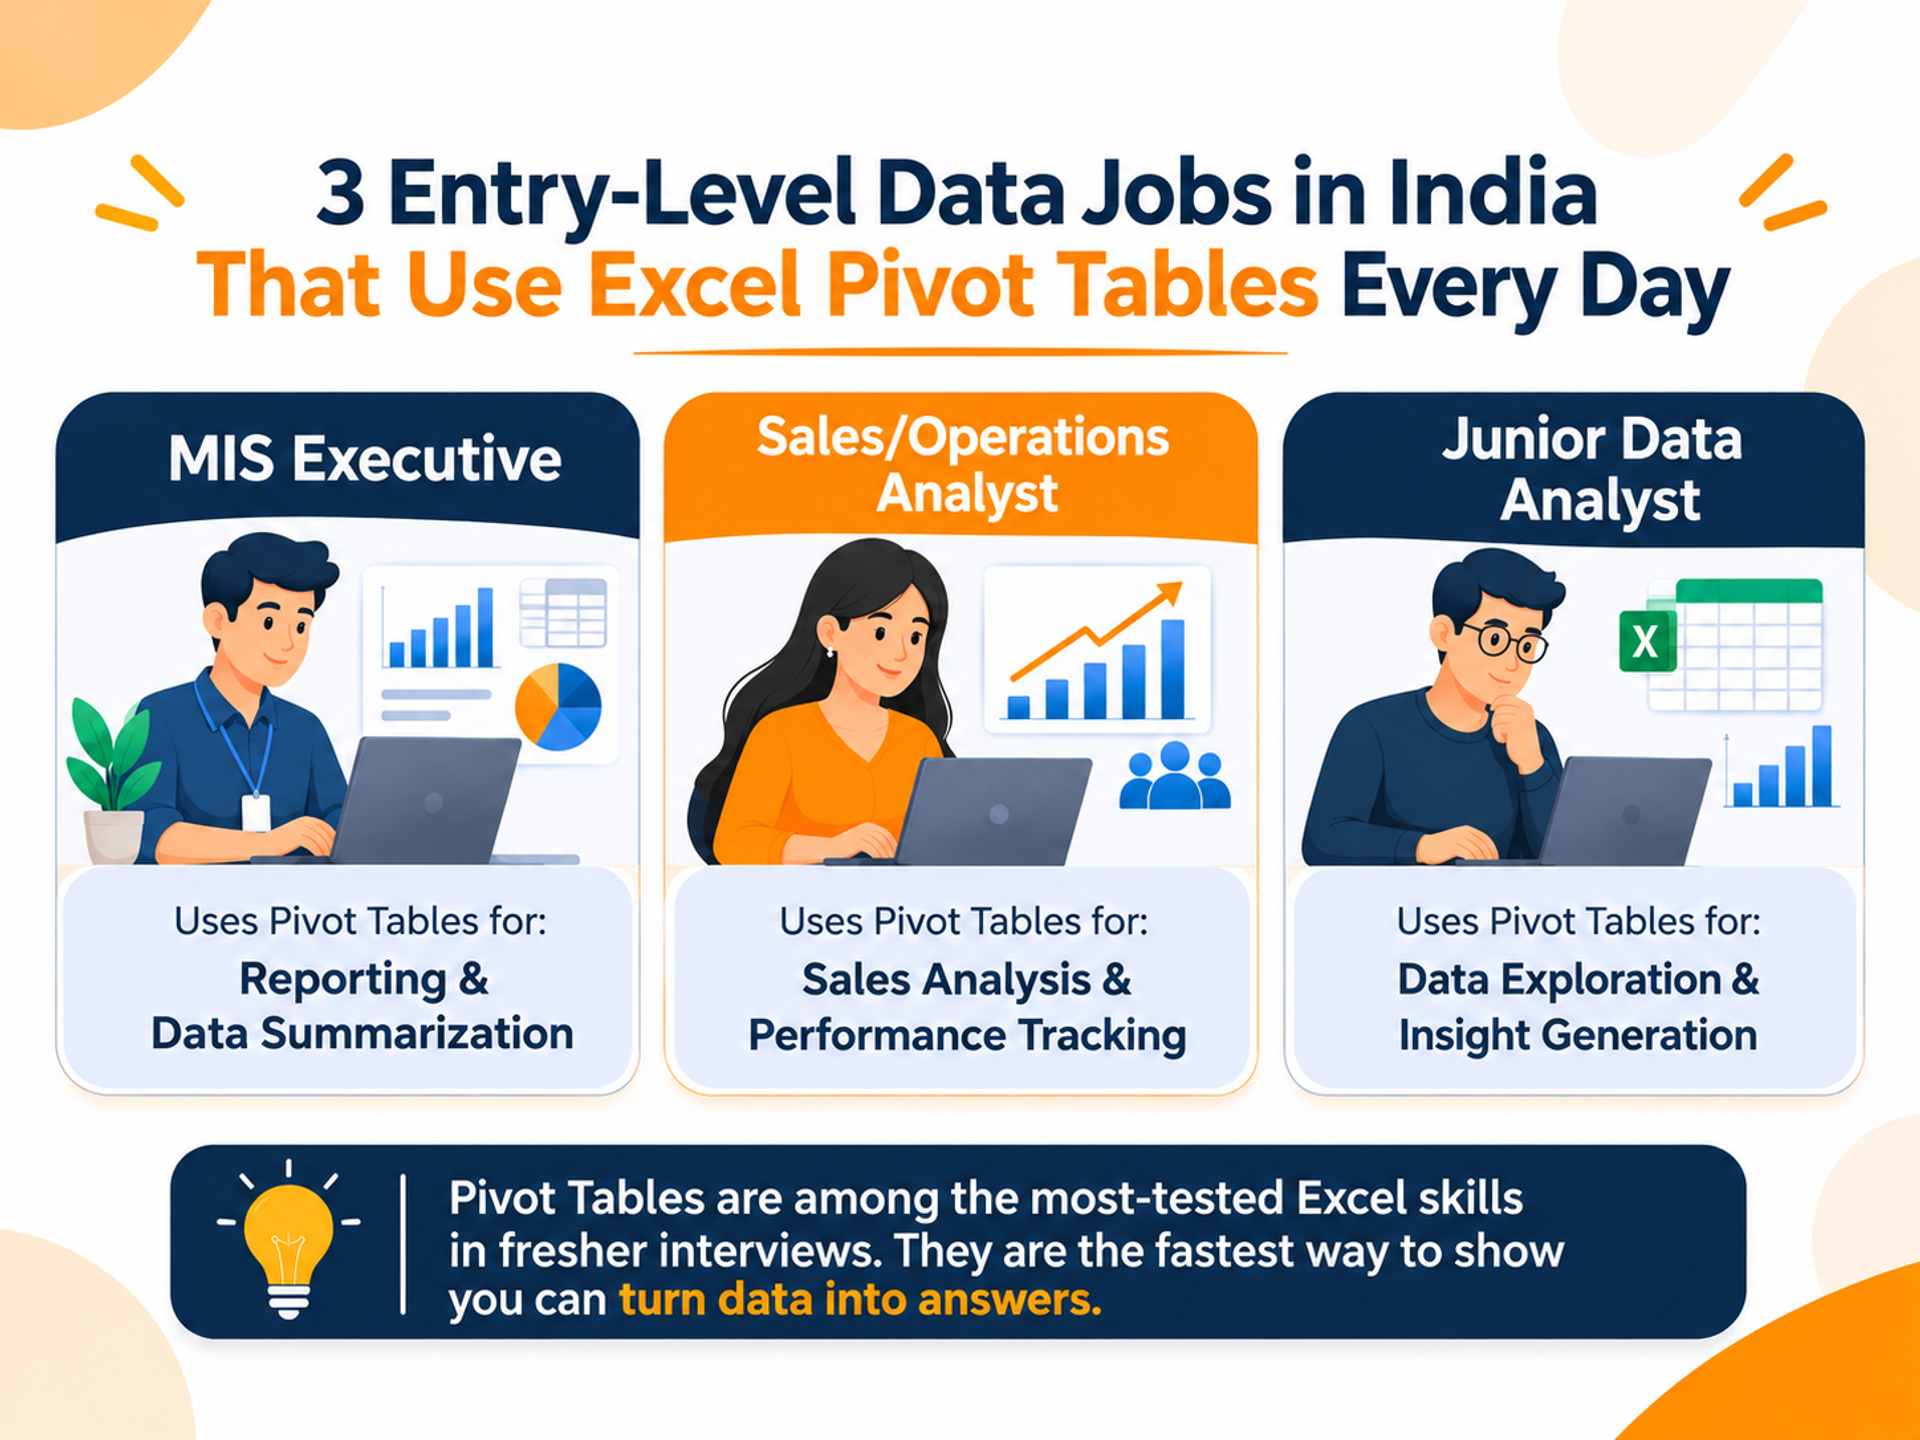
You can see this in job listings. Skill lists for MIS executive and analyst roles on Indian portals such as AmbitionBox and Indeed regularly show "Advanced Excel", "MIS Reporting" and "Data Analysis" together. Many companies also run a practical Excel test in the interview. A pivot table is usually the first thing they check.
Here is where the skill shows up and what entry-level roles typically pay:
Salary ranges are approximate, compiled from 2026 public salary trackers and career guides. Pay varies widely by city, company and skill set, so verify with a current industry source such as AmbitionBox, Naukri or Glassdoor before relying on these figures.
Notice the pattern in the last row. Pivot tables are an entry ticket, not the whole journey. Freshers who pair them with SQL and a visualisation tool tend to qualify for analyst roles rather than purely clerical reporting work.
Many of these listings also mention Power BI. The good news is that Power BI's Matrix visual uses the same rows-columns-values logic. That means Power BI dashboard training feels familiar once pivots click.
Strong Excel skills for freshers are also a confidence booster. Walking into an interview knowing you can answer a data question live changes how you present yourself.
How to Create a Pivot Table Step by Step (With Sales Data)
This Excel pivot table tutorial uses Excel for Microsoft 365 on Windows. Menu names differ slightly on Mac and older versions. Type the data below into a new sheet, starting at cell A1. Revenue is simply Units × Unit Price. Every result below shows exactly what your pivot table in Excel should display, so you can check your work.
Step 1: Turn the data into an Excel Table. Click any cell and press Ctrl + T, then click OK. Name it tbl_Sales under Table Design > Table Name. A Table grows automatically when you add rows, so your pivot never misses new orders.
Step 2: Insert the pivot table. Click inside the table and go to Insert > PivotTable > From Table/Range. Keep "New Worksheet" selected and click OK. A blank pivot and the PivotTable Fields pane appear. Microsoft's official guide to creating a PivotTable in Excel shows the same dialog with screenshots.
Step 3: Revenue by region. Drag Region to Rows and Revenue to Values. Excel shows "Sum of Revenue" because it sums number fields by default.
Step 4: Add the product split. Drag Product to Columns. You now have a two-way report.
Step 5: See the monthly trend. Remove Product and Region, then drag Order Date to Rows. Excel usually groups dates into months automatically, and sometimes adds Quarters and Years too. If it doesn't, right-click any date, choose Group, select Months and click OK. You will see Jan 1,98,000, Feb 2,37,000 and Mar 2,23,000.
Step 6: Show each region's share. Put Region back in Rows. Right-click any revenue number and choose Show Values As > % of Grand Total. You get West 48.9%, South 26.6% and North 24.5%.
Step 7: Add a slicer and refresh. Go to PivotTable Analyze > Insert Slicer, tick Product and click OK to get one-click filter buttons. When the source data changes, press Alt + F5 to refresh this pivot, or Ctrl + Alt + F5 to refresh all.
Now read the result like an analyst. West brings in almost half of all revenue, and laptop sales in Mumbai alone drive ₹2,40,000 of it. Monitors were ordered most often (5 of 12 orders) but earn the least per order. That is real sales data analysis in Excel, done in minutes.
Why not just use formulas? Here is how the main options compare:
For comparison, this single formula gives West's revenue from Step 3:
excel
=SUMIFS(G2:G13, B2:B13, "West")
G2:G13is the range to add up (the Revenue column).B2:B13is the range to check (the Region column)."West"is the condition each row must match.- Expected output: 322000, the same 3,22,000 shown in the pivot.
One formula answers one question. The pivot answered every region at once, and it re-answers when you drag a field.
The same idea carries into code. Pandas has a pivot_table() function that mirrors Excel's Rows, Columns and Values, so training in data analytics with Python libraries is a natural next step once Excel feels easy.
If you want to compare the two side by side, the official pandas pivot_table documentation maps each argument to the pivot areas you just used.
Common Pivot Table Mistakes Freshers Make
These five mistakes cause most beginner frustration with a pivot table in Excel. Each one is easy to avoid.
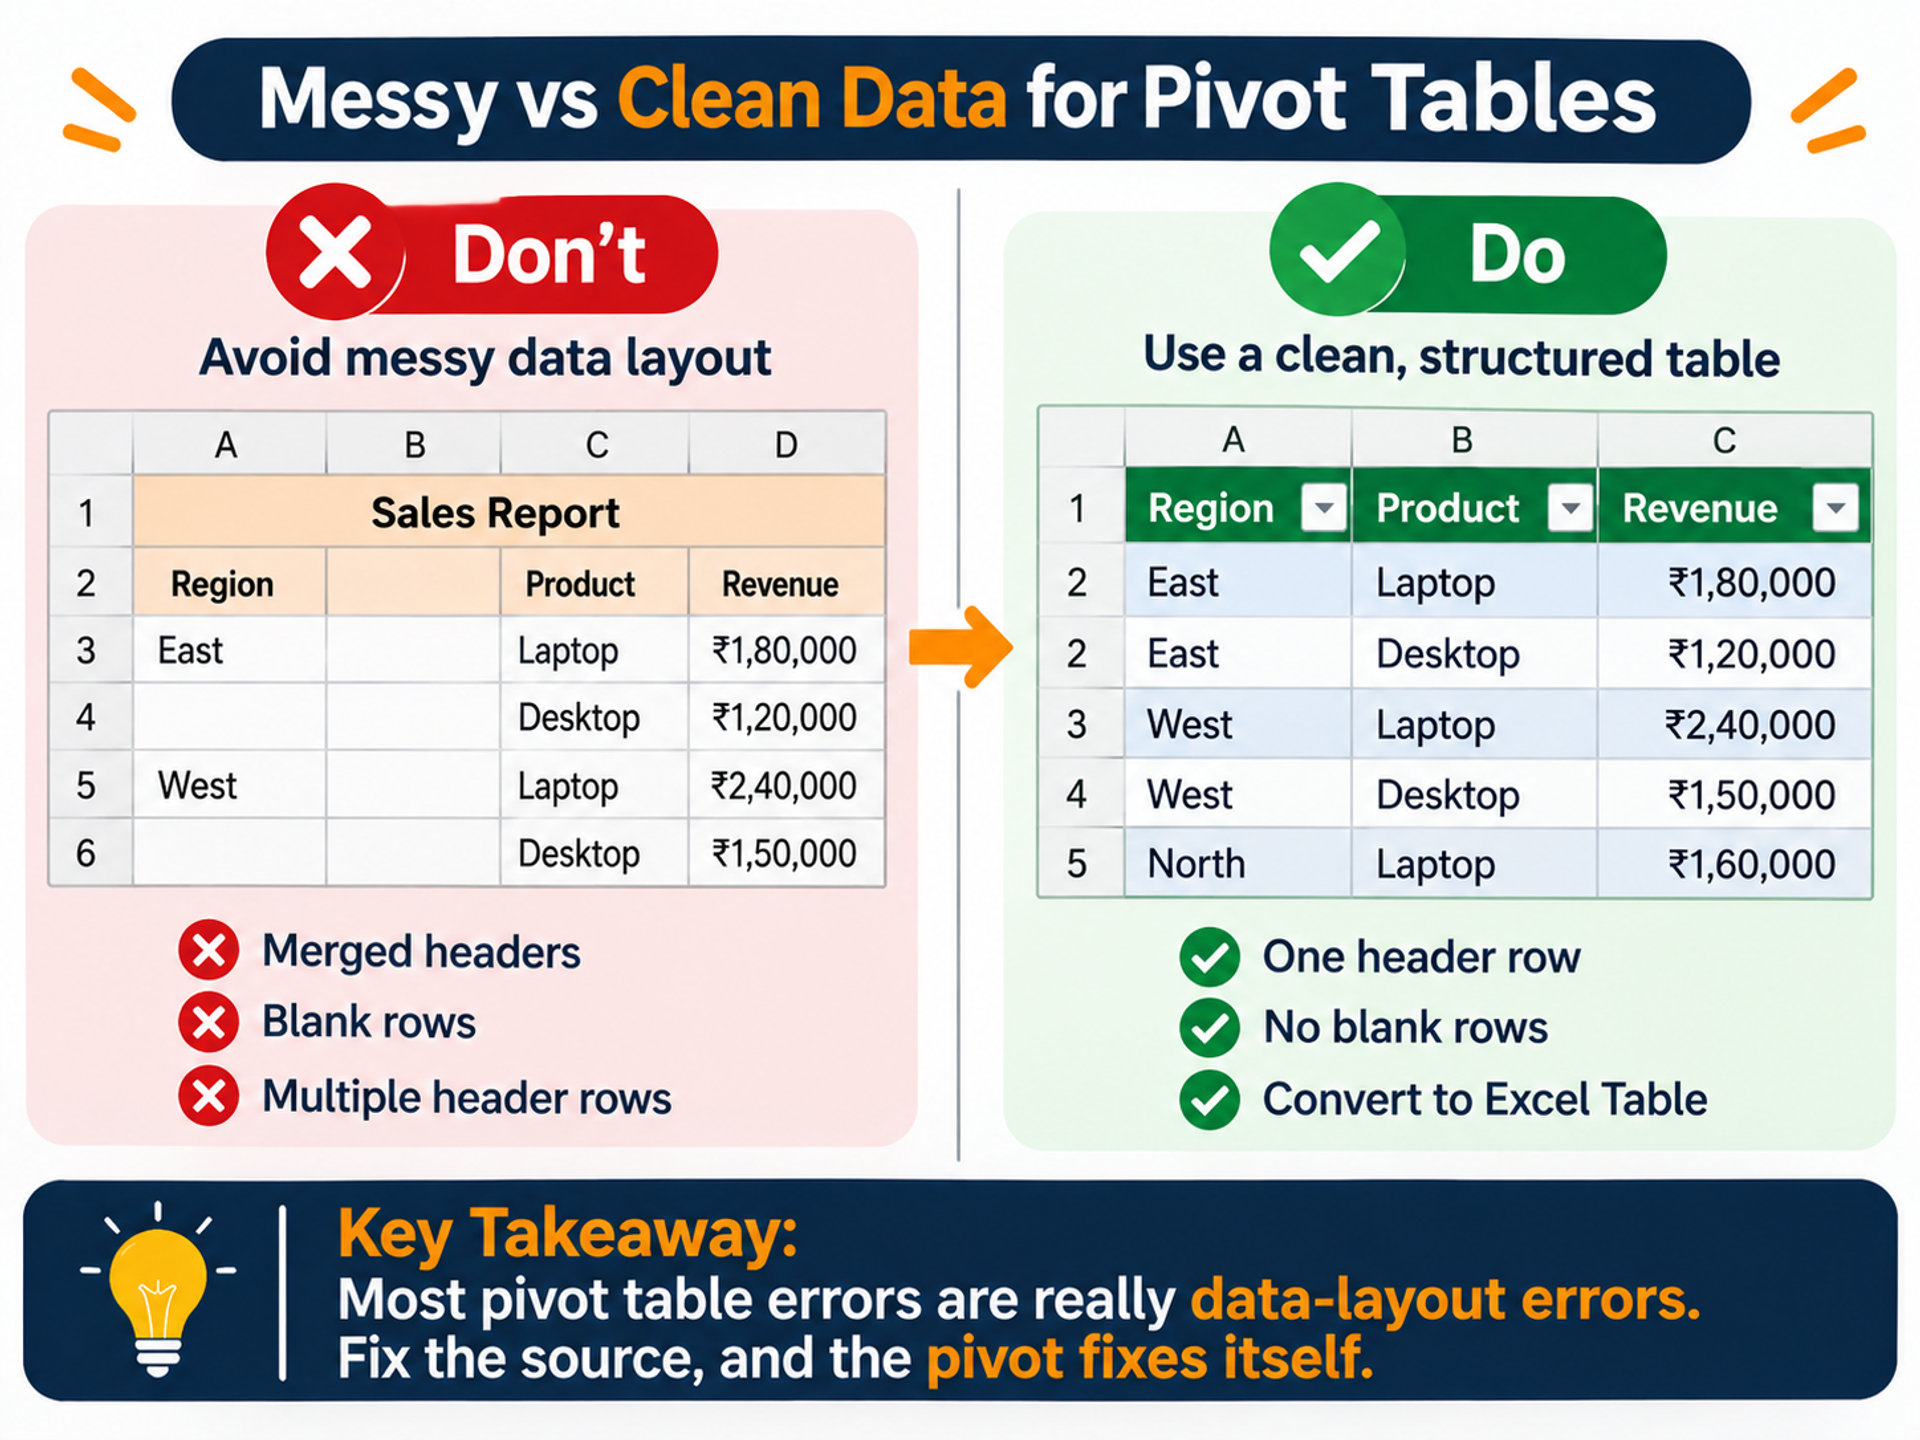
- Messy source data. Blank rows, merged headers or two header rows confuse Excel. Keep one header row and one record per row.
- Numbers stored as text. If Values shows "Count of Revenue" instead of "Sum", your numbers are probably text. Convert the column to Number format and refresh.
- Forgetting to refresh. A pivot table does not update on its own when source data changes. Make Alt + F5 a habit before sharing any report.
- Using a fixed range instead of a Table. If you selected A1:G13, row 14 will be ignored. Ctrl + T in Step 1 prevents this.
- Forcing Excel past its limits. A worksheet holds just over 10 lakh rows, and huge files slow down badly. Company data usually lives in databases, which is why learning SQL with MySQL is the logical next skill: a
GROUP BYquery is essentially a pivot table written in SQL.
A note on responsible practice. Real sales files often contain customer names, phone numbers and addresses. Before you share a pivot report, remove personal columns you don't need. Never send client data through personal email or WhatsApp. India's Digital Personal Data Protection Act, 2023 makes careless handling of personal data a legal risk, not just a bad habit. Share the summary, not the raw file, whenever you can.
Your Career Path After Learning Pivot Tables
A pivot table in Excel opens the door to entry-level reporting roles: MIS executive, sales coordinator and operations analyst. To move into analyst roles, build the next layers in this order:
- Excel depth: pivot charts, XLOOKUP, conditional formatting and basic dashboards.
- SQL: pull and summarise data straight from databases.
- A BI tool: Power BI or Tableau for interactive dashboards.
- Python (optional, later): Pandas for automation and larger datasets.
How long does this take? A realistic estimate for a focused fresher studying part-time is 4–6 months to become job-ready for entry-level analyst roles. Pivot tables take a week or two of practice, SQL and a BI tool take a few weeks each, and portfolio projects take the rest. Your pace will vary with practice hours and prior comfort with numbers.
Build at least two small projects along the way, such as a sales report and an HR attrition summary. Recruiters trust proof more than certificates.
If you want this roadmap in a structured format with hands-on projects, mock interviews and placement assistance, the Advanced Data Analytics Hero Program covers the journey from Excel to BI tools. Check the course page for the current syllabus and batch dates.
Conclusion
You now know how to create a pivot table in Excel and, more importantly, how to think with one. Three points to remember:
- Every pivot is just Rows, Columns, Values and Filters, arranged to answer one question.
- Clean, Table-formatted source data prevents almost every beginner error.
- Pivot tables are a starting point. Pair them with SQL and a BI tool to grow from reporting into analysis.
Before you close this tab, rebuild the four reports from the sample data on your own, without looking back. Then try a new question: which city has the highest average order value?
If you would like a trainer to guide you through hands-on projects like this, you can book a free demo class and see how the sessions work before deciding anything.
The fresher who can answer a data question in a minute is the one who gets noticed. With a little practice this week, that fresher can be you.
Frequently Asked Questions
1. What is a pivot table in Excel used for?
A pivot table in Excel summarises large datasets into short, readable reports without formulas. You use it to total sales by region, count orders by product, compare months or find each category’s share of the total. Because you can drag fields around, one pivot table answers many questions in seconds. That is why it is a core tool for MIS reporting, sales analysis and quick data checks before deeper work in SQL or Power BI.
2. How to update a pivot table in Excel when data changes?
Pivot tables do not update automatically. After changing the source data, click inside the pivot and press Alt + F5, or right-click and choose Refresh. Press Ctrl + Alt + F5 to refresh every pivot in the workbook. If new rows are not appearing, your pivot is probably using a fixed range. Convert the source to an Excel Table with Ctrl + T and point the pivot at the Table so it grows automatically.
3. Is learning pivot tables worth it for a data analyst job?
Yes, as a foundation, but not on its own. Pivot tables often appear in practical Excel tests for MIS, operations and junior analyst roles, and they teach you to think in groups and totals. However, analyst roles usually also expect SQL and a BI tool such as Power BI or Tableau. Treat pivot tables as your first skill, not your only one. Freshers who combine them with SQL and a portfolio project stand out more.
4. How long does it take to learn pivot tables in Excel?
Most beginners can build basic pivot tables within a day of hands-on practice. Getting comfortable with grouping dates, % of total, slicers and pivot charts usually takes one to two weeks of regular practice. The fastest way to learn is to use your own sample data and answer real questions with it. Practising on varied datasets, such as sales, HR or expenses, builds the speed interviewers look for.
5. How much does an MIS executive earn in India as a fresher?
Fresher MIS executives in India typically earn around ₹2–3.5 LPA. This figure is approximate and drawn from 2026 public salary trackers, so verify it with a current industry source such as AmbitionBox or Naukri. Pay depends on city, company size and skills. Candidates with strong Excel plus Power BI or SQL often move into analyst roles that pay more. Metros like Mumbai may offer higher ranges than smaller cities.
Tags

Cezzane Khan is a dedicated and innovative Data Science Trainer committed to empowering individuals and organizations.