
Power BI for Beginners: Build a Dashboard in 30 Minutes


Power BI for beginners starts with one small dashboard. In this guide, you will learn how Power BI works, follow a Power BI dashboard tutorial using practice data, and see where it can take your career as a fresher in India.
A beginner-friendly Power BI tutorial for freshers. Learn what Power BI does, build your first dashboard in 30 minutes, and plan your analyst career.
Power BI for Beginners: Build a Dashboard in 30 Minutes
You have a B.Com, BSc or engineering degree, and you are applying for analyst jobs from Borivali to Navi Mumbai. Many job descriptions list “Power BI” as a required skill, but your resume has no dashboard. This is where Power BI for beginners becomes a practical skill instead of a buzzword. In this guide from the trainers at Cinute Digital, you will learn what Power BI does, why Indian employers ask for it, and how to build a working dashboard in about 30 minutes. You do not need coding or a paid licence to start. You need a Windows laptop, a small sales file and half an hour. By the end, you will be able to explain your dashboard to an interviewer in plain words. Ready to turn a boring spreadsheet into something a manager actually wants to open?
Power BI is Microsoft’s tool for turning raw data into interactive charts and reports. To build your first dashboard, install Power BI Desktop, load a clean Excel or CSV file, create cards, charts and slicers, then save the file. A beginner can finish a simple version in about 30 minutes.
Power BI for Beginners: What It Is and How It Works
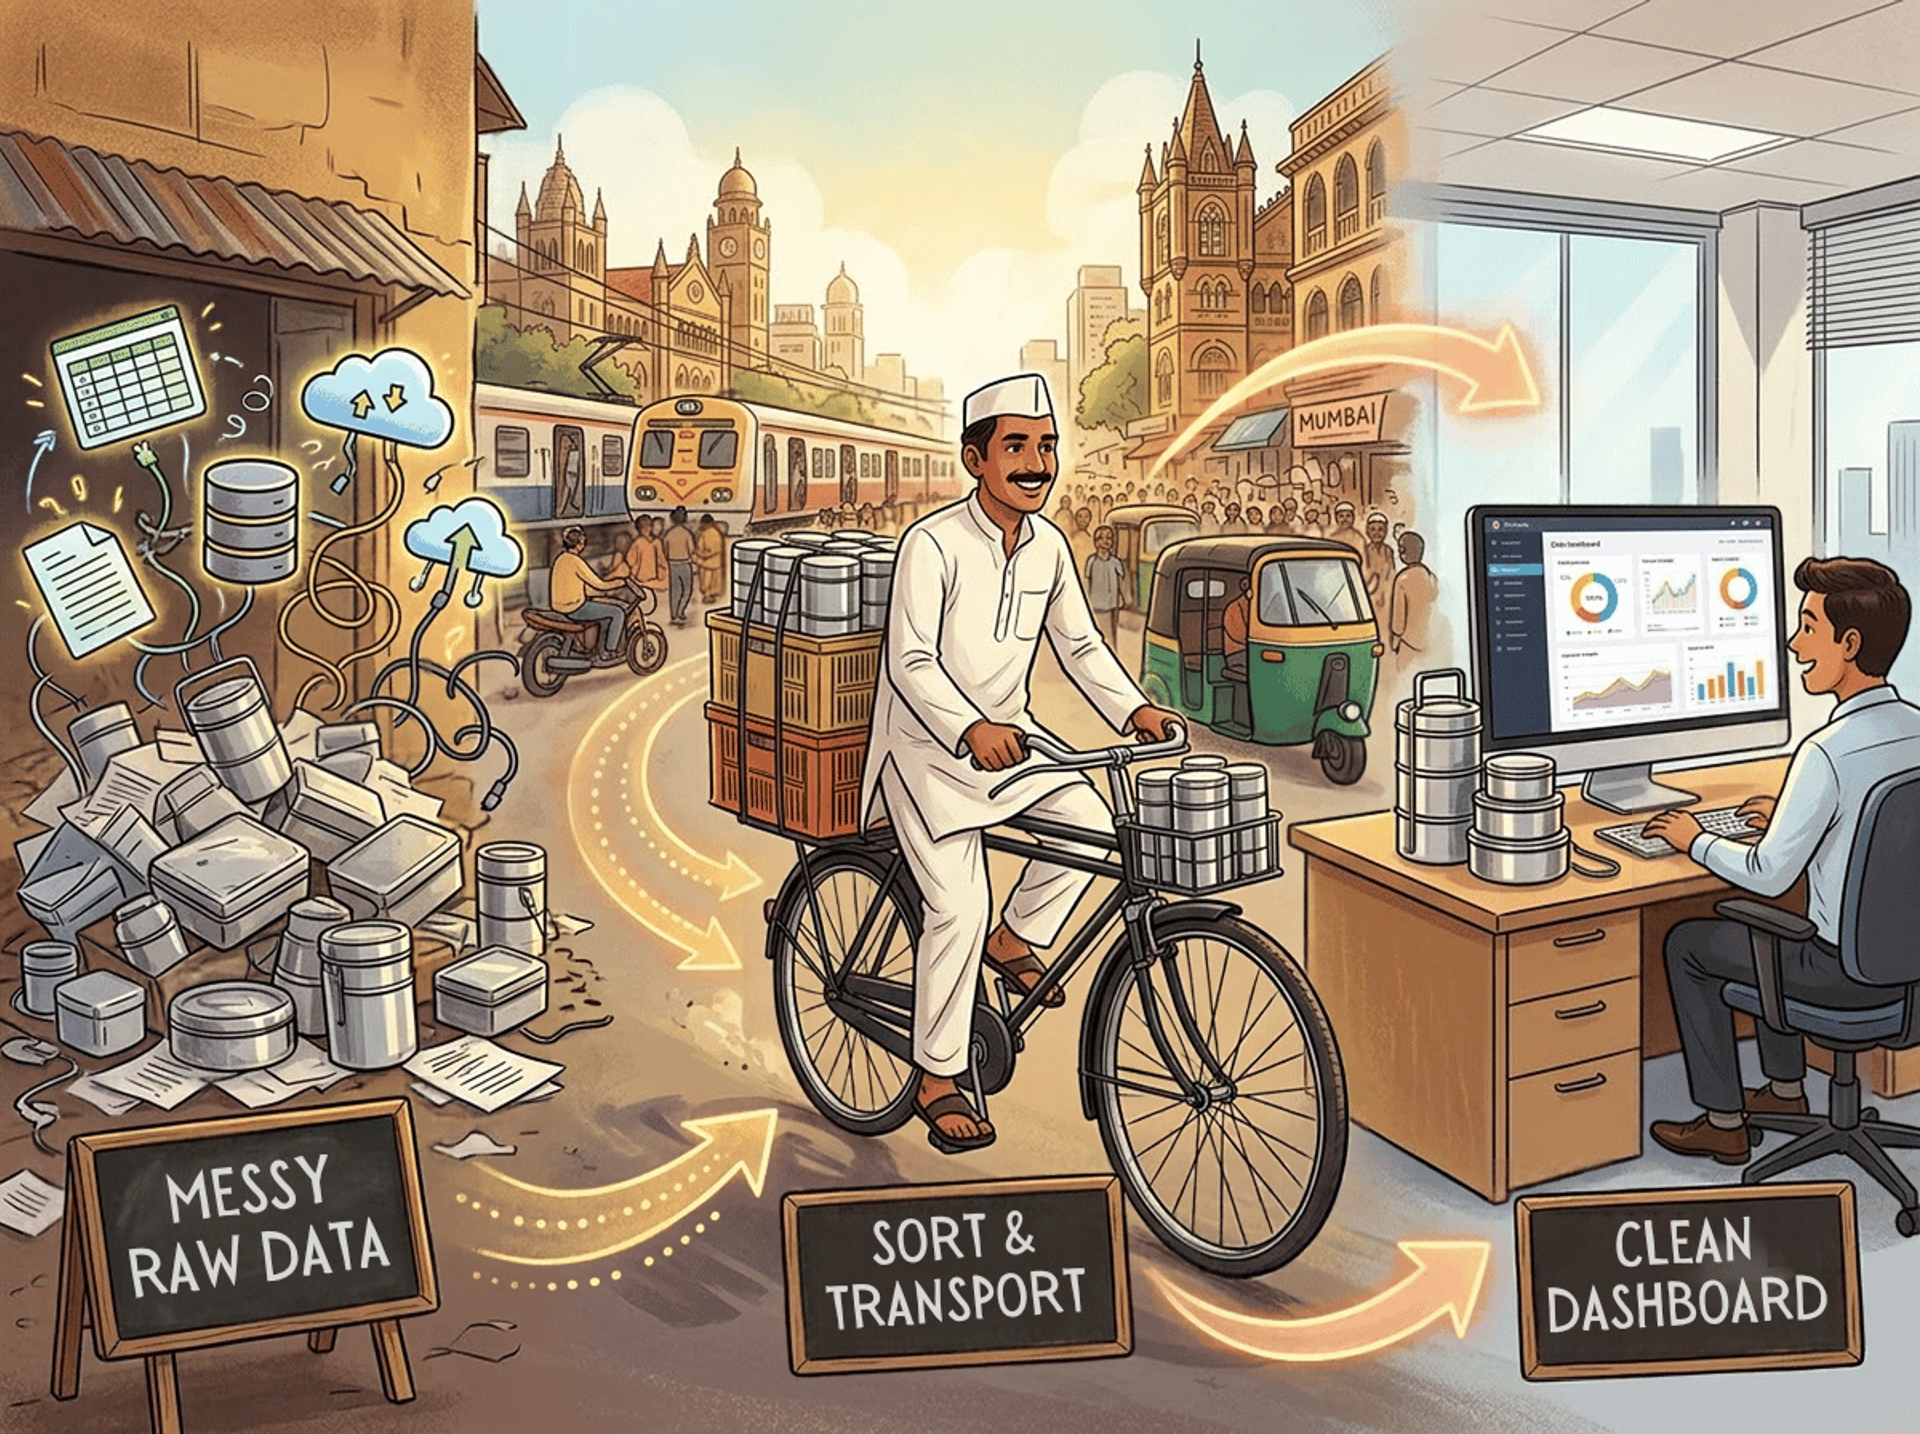
Think of Mumbai’s dabbawalas. They collect tiffins from thousands of homes, sort them using simple codes and deliver each one to the right desk on time. Power BI works the same way for data. It collects data from files and databases, sorts and cleans it, and delivers it as charts a manager can read in seconds.
A dashboard is a single page of visuals, such as cards, charts and filters, that answers a business question at a glance. For example: “Which city sold the most last month?”
Power BI has three parts you should know:
- Power BI Desktop: the free Windows app where you build reports.
- Power BI Service: the online space where you publish and share reports.
- Power BI Mobile: the phone app for viewing dashboards on the go.
As a beginner, you will spend most of your time in Desktop. Sharing online depends on Microsoft’s licensing, which changes, so check Microsoft’s official page before you plan to publish.
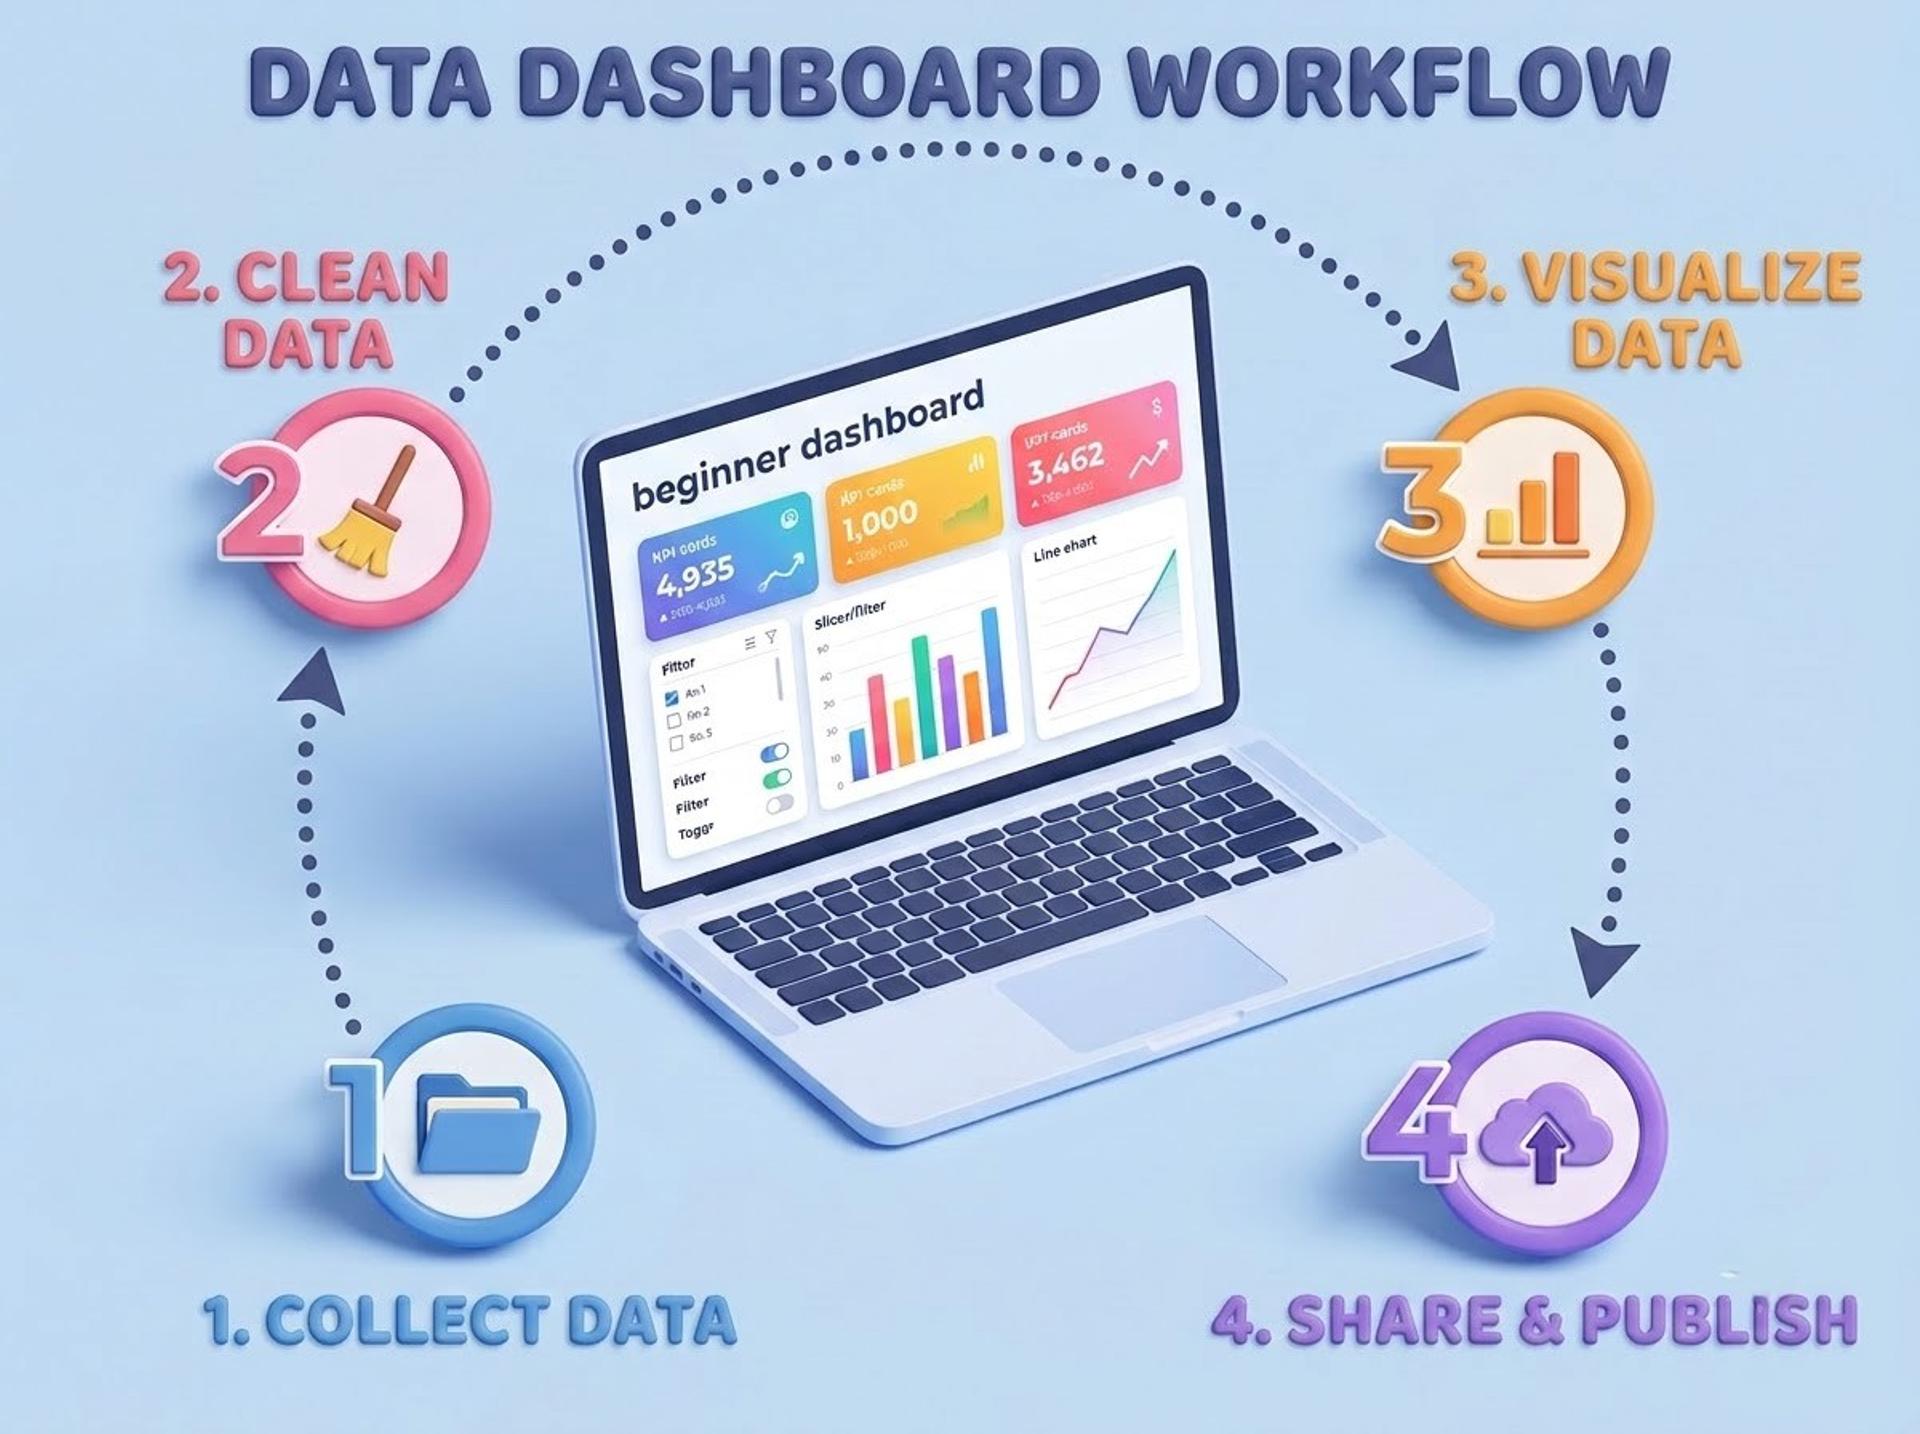
Every project follows four steps: get data, clean it, build visuals and share. The cleaning step uses a tool called Power Query. If you have ever removed blank rows in Excel, you already understand the idea.
That brings us to Power BI vs Excel. Excel is great for calculations and quick analysis on one file. Power BI is better when you handle larger datasets, many sources and interactive reports that refresh easily. Neither replaces the other, and most analysts use both. A strong base in Excel for data analytics will make your first week in Power BI much smoother.
One honest warning: Power BI Desktop runs only on Windows. Mac users need a workaround, such as a Windows PC or a virtual machine.
Why Power BI Skills Matter for Indian Jobs in 2026
Companies in India collect more data every year, from UPI payments to e-commerce orders. Banks, retailers, logistics firms, hospitals and IT services companies all need people who can turn that data into decisions. Dashboards are how those decisions reach managers.
Power BI appears often in analyst job descriptions because many organisations already use Microsoft tools. Treat that as a market pattern to verify on live job portals for your target city, not as a promise.
Roles where Power BI helps include:
- Data Analyst
- BI or Reporting Analyst
- MIS Executive
- Junior Business Analyst (with domain knowledge)
Entry-level analyst roles in Indian metros often fall in roughly ₹3–6 lakh per year (approximate verify with a keyword/industry tool or current job listings). Pay varies by city, company and how well you combine Power BI with SQL and Excel.
Here is a balanced verdict. Power BI for freshers is a smart first tool if you enjoy numbers, patterns and explaining insights. It suits graduates from commerce, science, engineering and statistics backgrounds. It suits you less if you want to avoid data work, or if you want to focus mainly on programming or machine learning. In that case, a Python-first path fits better. Alternatives include Tableau, Excel dashboards and Google’s Looker Studio. No single tool wins everywhere.
Also remember that Power BI alone will not get you hired. Employers look for Excel, SQL, clear communication and one portfolio project. A structured advanced data analytics program can bring these skills together under trainer guidance, which helps when self-study feels scattered.

How to Build a Power BI Dashboard in 30 Minutes (Step-by-Step)
This Power BI dashboard tutorial uses practice data and six time-boxed steps. The 30 minutes assume Power BI Desktop is installed and your file is clean. Treat the result as a first draft, not a boardroom report.
Before you start: install the free Power BI Desktop from Microsoft’s website. Then create a practice Excel or CSV file with about 30 rows and five columns: Order Date, City, Category, Sales Amount and Profit. Use made-up numbers, never your employer’s data.
- Minutes 0–5, load data. Click Home → Get data → Text/CSV (or Excel workbook), select your file, then choose Transform Data.
- Minutes 5–10, clean it. In Power Query, check that Order Date is a Date type and that Sales Amount and Profit are numbers. Remove blank rows, then click Close & Apply.
- Minutes 10–15, add KPI cards. Drag Sales Amount onto the canvas and switch the visual to Card. Repeat for Profit.
- Minutes 15–22, add charts. Build a clustered bar chart with Category and Sales Amount. Add a line chart with Order Date and Sales Amount.
- Minutes 22–26, add a slicer. Insert a Slicer and drop City into it. Click a city and watch every visual update. This interactivity is why dashboards beat static charts.
- Minutes 26–30, polish and save. Add clear titles, align the visuals in a grid and save as a .pbix file.
Now add one smarter number with DAX, Power BI’s formula language. Go to Home → New measure and create each line below as its own measure:
DAX
Total Sales = SUM(Sales[Sales Amount])
Profit Margin % = DIVIDE(SUM(Sales[Profit]), SUM(Sales[Sales Amount]))
- Line 1:
SUMadds every value in the Sales Amount column of the table named Sales. Your table takes its name from your file, so adjust it if needed. - Line 2:
DIVIDEdivides total profit by total sales. It returns a blank instead of an error if sales are zero. - Expected output (example numbers): if sales total ₹4,50,000 and profit is ₹81,000, the margin card shows 18% once you format it as a percentage.
Power BI vs Excel vs Tableau
If you would rather learn with a trainer, projects and feedback, CDPL’s hands-on Power BI course covers this workflow in more depth. Confirm the current syllabus and duration on the course page.
5 Beginner Mistakes to Avoid (and a Note on Data Ethics)
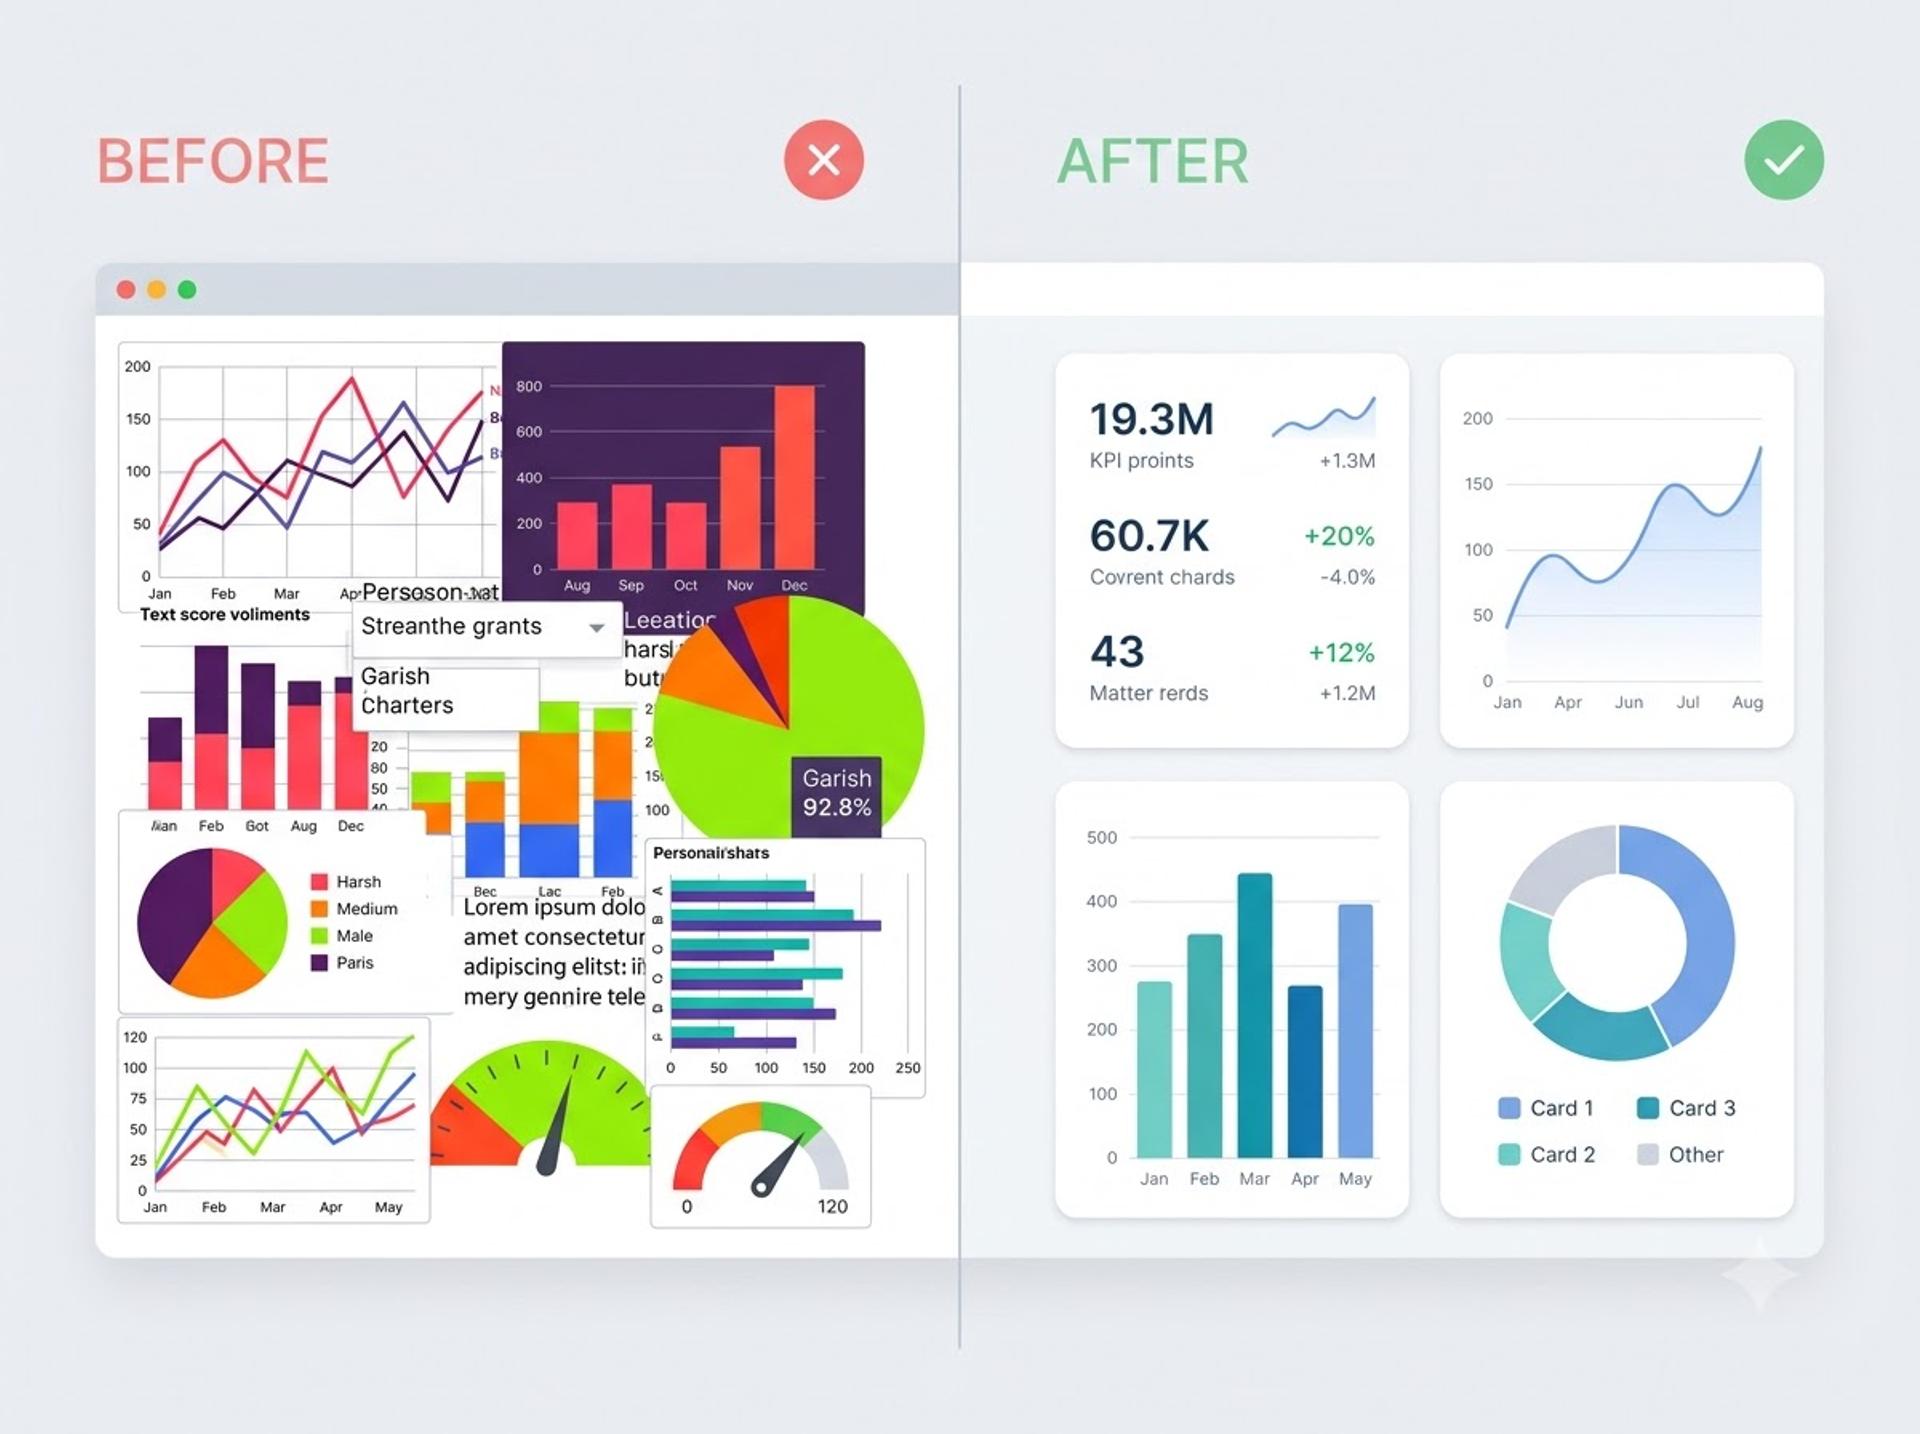
- Skipping data cleaning. Wrong data types and blank rows produce wrong charts. Check Power Query first.
- Starting without a question. A dashboard with no question is decoration. Write it first, for example: “Which city earns the lowest margin?”
- Cramming in too many visuals. Five to seven visuals are plenty for a first dashboard. Remove anything that does not answer your question.
- Choosing the wrong chart. Use lines for trends, bars for comparisons and cards for single totals. Avoid pie charts with many slices.
- Ignoring SQL. Real company data usually sits in databases, not tidy Excel files.
Most beginners hit that last wall in their first job. Learning SQL fundamentals with MySQL is a natural bridge. Power BI reads data from databases, and SQL is how you ask those databases the right questions.
Ethics and responsible practice. Never put real customer or employer data in a public portfolio. Use sample or anonymised data. India’s Digital Personal Data Protection Act, 2023 also raises the bar on handling personal data, so treat names, phone numbers and addresses with care. When you share reports, give access only to people who need them.
Career Path: From Your First Dashboard to Your First Job
A first dashboard is a start, not the finish line. Power BI for beginners leads to roles such as Data Analyst, BI Analyst, Reporting Analyst, MIS Executive and Junior Business Analyst.
A sensible learning order looks like this:
- Excel basics and pivot tables
- SQL for pulling data
- Power BI Desktop, including data modelling and DAX
- Two or three portfolio dashboards built on sample data
- Python or Tableau next, depending on the role you want
Many learners need roughly three to six months of steady practice to feel interview-ready for entry-level analyst roles (approximate; it varies with your background and weekly hours).
If you are searching for a Power BI course in Mumbai, check that it includes projects, feedback and interview preparation, not just tool demos. Once dashboards feel comfortable, the next logical skill is big data engineering, which teaches you to build the pipelines that feed Power BI. CDPL’s Data Analytics with BI master program is listed at 155 hours and covers Power BI/Tableau, Spark, Hadoop, ETL pipelines and data warehousing. Please confirm hours and tools on the course page. CDPL offers live online and classroom options, hands-on projects, mock interviews, resume support and placement assistance, but no guaranteed jobs or salaries.
FAQ SECTION
1. What is Power BI used for?
Power BI is used to connect to data from files, databases and online services, clean it, and present it as interactive reports and dashboards. Businesses use it to track sales, costs, customers and operations. Analysts use it to answer questions like which city performs best or which product loses money. It is popular because beginners can start with simple drag-and-drop steps.
2. How to create a dashboard in Power BI for beginners?
Install Power BI Desktop, load a clean Excel or CSV file, and check data types in Power Query. Then add cards for key totals, a bar chart by category, a line chart by date and a slicer for filtering. Align the visuals, add clear titles and save the .pbix file. A simple version takes about 30 minutes once the tool is installed.
3. Is Power BI worth learning for freshers in 2026?
For many freshers, yes, especially if you target analyst, MIS or reporting roles. It is beginner-friendly and widely used. However, Power BI alone is not enough. Pair it with Excel, SQL and one portfolio project. If you prefer programming-heavy roles, Python or Tableau may suit you better. Check current job listings in your city before deciding.
4. How long does it take to learn Power BI?
You can build a basic dashboard in a day. Becoming comfortable with data cleaning, modelling and DAX usually takes several weeks of regular practice, and being interview-ready often takes a few months. These timelines are approximate and depend on your practice hours, your Excel and SQL base, and the guidance you get.
5. How much does Power BI cost?
Power BI Desktop is free to download and use for building reports on your own computer. Publishing and sharing reports online usually needs a paid or organisation-provided licence. Plans and prices change, so check Microsoft’s official Power BI pricing page for current details. For learning and portfolio practice, the free Desktop app is enough to start.
Conclusion
Let us recap the three points that matter most.
First, Power BI for beginners is easier than it looks. A dashboard is a business question answered on one page, and you can build a simple one in about 30 minutes.
Second, clean data and a clear question matter more than fancy visuals. Fix your data types, limit your charts and respect data privacy.
Third, Power BI works best alongside Excel, SQL and a small portfolio. Tools alone rarely get you hired, but proof of your thinking does.
If you want guided practice, you can book a free demo class and see whether the teaching style suits you. If you prefer to continue alone, build two more dashboards this week with different practice data. Your first one will look rough, and that is fine. Every analyst started with one.
Tags

Cezzane Khan is a dedicated and innovative Data Science Trainer committed to empowering individuals and organizations.